Holiday Break?
With the holiday season upon us, things will likely start to slow down considerably for the next two weeks. So, be advised that volatility can pick up when nobody's home.
But with that said, let's start the week with a review of our major stock market indicators. To review, the goal of this exercise is to set aside our subjective views and perform a disciplined, unemotional review of what actually "is" happening in the market.
The State of the Trend
We start with a look at the "state of the trend" from our objective indicator panel. These indicators are designed to give us a feel for the overall health of the current short- and intermediate-term trend models.
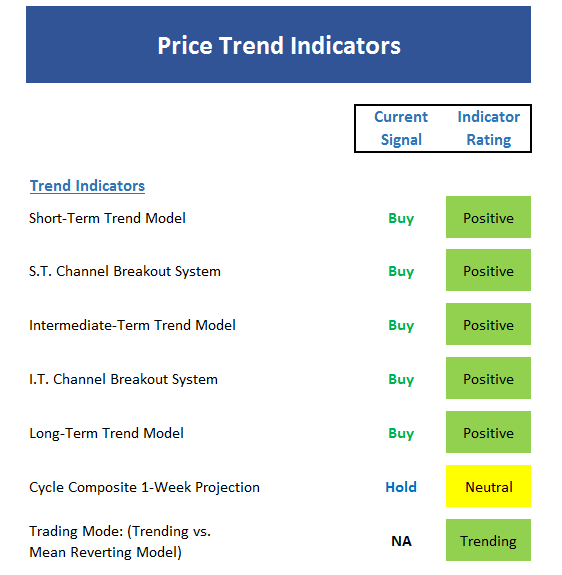
Executive Summary:
- Despite the recent sloppy action, the trend board is within a whisker of being completely green
- The minor pullback Wed-Fri was to be expected and did little technical damage
- After such a strong run since November 7th, the bulls deserve a chance to pause and regroup
- However, the short-term trend, while still positive, has weakened a bit
- Our short-term Channel Breakout system would turn negative at 2237
- The Cycle Composite is sideways for the week. Then positive next week.
- At this stage, the trend is your friend.
The State of Internal Momentum
Now we turn to the momentum indicators...
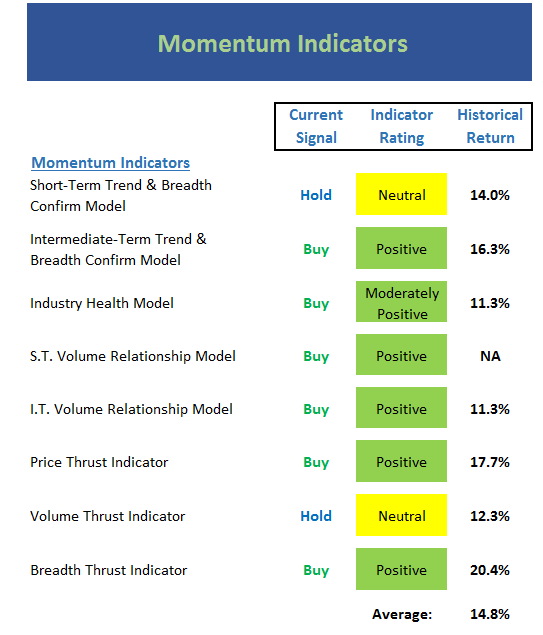
Executive Summary:
- The uber-sensitive Trend & Breadth model is neutral, which is a sign of a tired market
- The Industry Health model continues to tease us and hover around the outright positive level
- Volume Relationship models both remain solidly positive
- The Thrust Indicators are starting to weaken a bit, but positive overall
- The historical return mode remains well above average
- All in all, momentum is in good shape
The State of the "Trade"
Next up is the "early warning" board, which is designed to indicate when traders may start to "go the other way" -- for a trade.
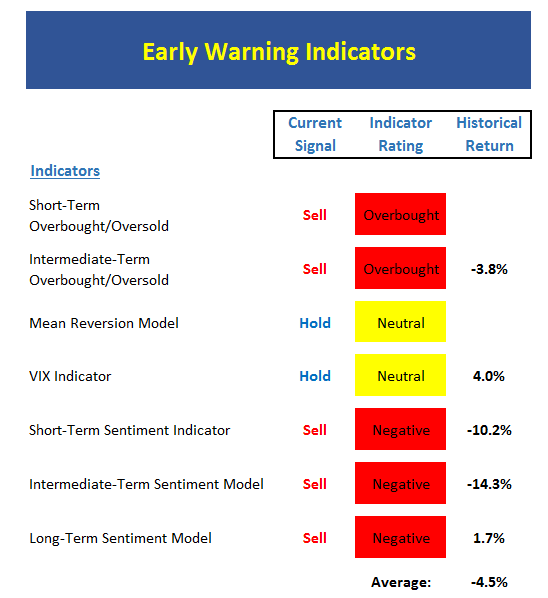
Executive Summary:
- If you want to worry, this board provides a reason
- In short, stock remain overbought and the current rate of advance is unsustainable
- The Mean Reversion model remains neutral but is moving closer to a sell signal
- The short-term VIX signal (not shown) gave an ill-timed sell but is now back to neutral
- The intermediate-term VIX signal is closing in on an extreme reading, which could then become a sell signal
- Sentiment has reached "extreme" levels and represents a warning sign here
- But remember, markets that become overbought and stay overbought are considered to be strong
The State of the Macro Picture
Now let's move on to the market's "external factors" - the indicators designed to tell us the state of the big-picture market drivers including monetary conditions, the economy, inflation, and valuations.
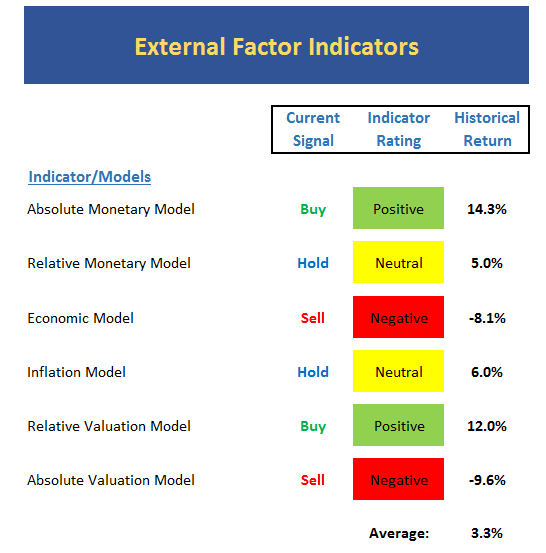
Executive Summary:
- The External Factors board looks like a Christmas tree
- Surprisingly, the Relative Monetary model moved to neutral
- The Economic model designed to call stocks obviously hasn't gotten the Trump Trade memo yet
- As we've been talking about for months, the Inflation models are ALL trending higher now
- Absolute Valuation model is improving slightly
- Overall historical return of this model set is underwhelming
The State of the Big-Picture Market Models
Finally, let's review our favorite big-picture market models, which are designed to tell us which team is in control of the prevailing major trend.
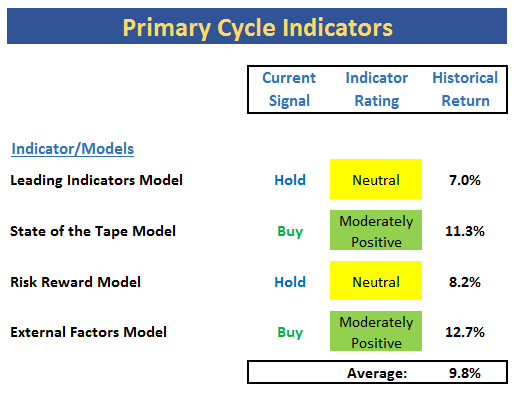
Executive Summary:
- The Leading Indicators model has been doing some flip-flopping of late. Currently neutral.
- The Risk/Reward model continues to struggle with the big jump in interest rates, but is back to neutral this week
- The historical return of the current model readings is about in line with the long-term mean
- This board tells me to give the bulls the benefit of any doubt
The Takeaway...
With the Trump Trade rally taking many by surprise, we have seen managers scrambling to get long into year-end. This has left stocks overbought and ripe for a consolidation phase. What that phase will look like is anybody's guess, of course. My feeling is that any pullback in 2016 will be short and shallow. However, there IS a tendency for the market to sell off on the last day or two of the year. So, we need to stay on our toes. But the bottom line is that the bulls have the edge and the dips should be bought (in my humble opinion, that is!).
Publishing Note: I am traveling the first half of the week and then the Holiday Season arrives shortly thereafter. During this time of year, I like to take a break from the keyboard and recharge the batteries. So for the next couple weeks, I'll publish reports only if big things happen in the markets.
Here's wishing you and yours a Happy Holiday Season!
Current Market Drivers
We strive to identify the driving forces behind the market action on a daily basis. The thinking is that if we can both identify and understand why stocks are doing what they are doing on a short-term basis; we are not likely to be surprised/blind-sided by a big move. Listed below are what we believe to be the driving forces of the current market (Listed in order of importance).
1. The State of the "Trump Trade"
2. The State of Global Central Bank Policies
3. The State of U.S. Dollar
4. The State of Bond Yields
Thought For The Day:
The man who has no imagination has no wings. -Muhammad Ali
Wishing you green screens and all the best for a great day,

David D. Moenning
Chief Investment Officer
Sowell Management Services
Looking for a "Modern" approach to Asset Allocation and Portfolio Design?
Looking for More on the State of the Markets?
Investment Pros: Looking to modernize your asset allocations, add risk management to client portfolios, or outsource portfolio Management? Contact Eric@SowellManagement.com
Disclosures
The opinions and forecasts expressed herein are those of Mr. David Moenning and may not actually come to pass. Mr. Moenning's opinions and viewpoints regarding the future of the markets should not be construed as recommendations. The analysis and information in this report is for informational purposes only. No part of the material presented in this report is intended as an investment recommendation or investment advice. Neither the information nor any opinion expressed constitutes a solicitation to purchase or sell securities or any investment program.
Any investment decisions must in all cases be made by the reader or by his or her investment adviser. Do NOT ever purchase any security without doing sufficient research. There is no guarantee that the investment objectives outlined will actually come to pass. All opinions expressed herein are subject to change without notice. Neither the editor, employees, nor any of their affiliates shall have any liability for any loss sustained by anyone who has relied on the information provided.
The analysis provided is based on both technical and fundamental research and is provided "as is" without warranty of any kind, either expressed or implied. Although the information contained is derived from sources which are believed to be reliable, they cannot be guaranteed.
David D. Moenning is an investment adviser representative of Sowell Management Services, a registered investment advisor. For a complete description of investment risks, fees and services, review the firm brochure (ADV Part 2) which is available by contacting Sowell. Sowell is not registered as a broker-dealer.
Employees and affiliates of Sowell may at times have positions in the securities referred to and may make purchases or sales of these securities while publications are in circulation. Positions may change at any time.
Investments in equities carry an inherent element of risk including the potential for significant loss of principal. Past performance is not an indication of future results.
Advisory services are offered through Sowell Management Services.