How Did This Happen?

And just like that, the game has changed. Almost completely. Gone is all the fretting about inflation, the Fed's final few rate hikes, and the corresponding impacts on the economy and earnings. Instead, investors of all shapes and sizes find themselves faced with a banking crisis.
To be sure, investors have seen this movie before. Although it has been awhile since the state of the banking system was the focal point of markets around the world, the bottom line is there is never just one bank failure. Nope, like a discovery of cockroaches in the kitchen of the summer cabin, where there is one, there are bound to be more. Perhaps a lot more.
First there was Silvergate. Then Silicon Valley Bancorp. And then Signature Bank. And then... As such, the question quickly becomes, who's next? Oh, and how far will the "contagion" from this mess spread? (As in, which banks have exposure to the banks in trouble and what action will be required?)
But the real question investors may be asking themselves is, how did this happen in this day and age? Didn't the good 'ol USofA fix this situation after the Great Financial Crisis of 2008? Didn't the Dodd-Frank bill put safety nets in place? And hadn't all the banks insulated themselves from the problems created by the seemingly never-ending string of problems with banks in Greece in 2010, 2011 and so on?
It turns out the answer is, not so much. Apparently, deregulation and political lobbying is to blame. Case in point. Unbeknownst to the vast majority of investors who don't spend their time analyzing the banking sector, in 2018, mid-sized banks were granted the ability to skip a lot of the requirements the big boys had to satisfy.
According to Bloomberg, it turns out that the non-megabanks don't have to "mark" their holdings of U.S. Treasury bonds "to market." Wait, what?
Yep, that's right. If you are a regional bank focused on lending to risky startups or crypto, you don't have to put the losses you have on all those Treasury bonds you bought back when rates were half what they were last week. Nope, you can just leave them on your books at par value. Until you sell them, of course.
And just like the alphabet soup of derivatives that nearly sank the banking system in 2008, it's the price of those assets that have to be sold that becomes the problem - in a hurry.
Let's use the example of Silicon Valley Bancorp as an example of how this debacle got started. Silicon Valley Bancorp (SIVB) specialized in lending to technology startups with oftentimes questionable collateral. With rates at all-time lows for an extended period of time, this wasn't a problem. With tech exploding, SVB became one of the biggest banks around. Business was good. And a lot of very big names invested.
But then the Fed started its fight against inflation.
With rates rising quickly due to Fed's hiking campaign, SVB's customers (you know, the one's with that questionable collateral) started to have problems borrowing money. So instead, they started withdrawing the actual cash they had in the bank to fund their "cash burns." The loss of deposits at the bank created stress on bank reserves, forcing SVB to sell treasury holdings to stay kosher with banking laws.
The problem is those Treasury bonds, which had been carried on the books at par value, wound up creating about $1.8 billion in "real losses." So, with SVB suddenly short on capital, the bank attempted to raise money. At the same time, word got out and a "run" on the depositor's funds began. SVB was taken over by the regulators the next day.
Over the weekend, the government stepped in by taking over another bank or two, guaranteeing the depositors money (without using the term "bailout," of course), establishing a backstop lending program to allow ALL banks to avoid "runs" going forward, and began the process of selling off the assets of the fallen banks.
The response by markets has been swift. In short, rates dove in a "flight to quality move," the likes of which hasn't been seen in quite some time. For example, the yield on the 2-Year made the biggest move since the 1980's. The 10-year went from 4.07% to 3.4% - in a little over 2 trading days.
Next, the potential crisis also throws a monkey wrench in the Fed's inflation fight. Since one of the central bank's mandates is to "maintain financial stability," analysts quickly realized Powell's bunch no longer had a green light to raise rates willy nilly.
No, many have argued that it was the Fed's record-breaking rate hike campaign that was the root cause of the burgeoning banking crisis. In other words, "stuff is definitely starting to break." And since history shows that the Fed "hikes until it breaks things," the thinking is Powell & Co. will be forced to change their plans in order to keep the banking system safe.
So, despite inflation staying hot in February, the markets are now pricing in a 40% chance of NO rate hike at next week's FOMC meeting. And the odds of any 50 basis point hikes in the future, which were 80% last week, are now 0%. Oh and the "Terminal Rate," is now being priced in the range of 4.75% to 5.00%, which is down from last week's 5.6875% level seen last week.
The good news is that markets appear to be stabilizing a bit today as there may have been some "overreactions" in the markets (gee, that never happens, right?) over the last couple days. But it is probably a safe bet that we haven't seen/heard the last of this adventure. And as such, my take is it is a good idea to keep your eyes and ears open and remain flexible for now.
Now let's review the "state of the market" through the lens of our market models...
Primary Cycle Models
Below is a group of big-picture market models, each of which is designed to identify the primary trend of the overall "state of the stock market."
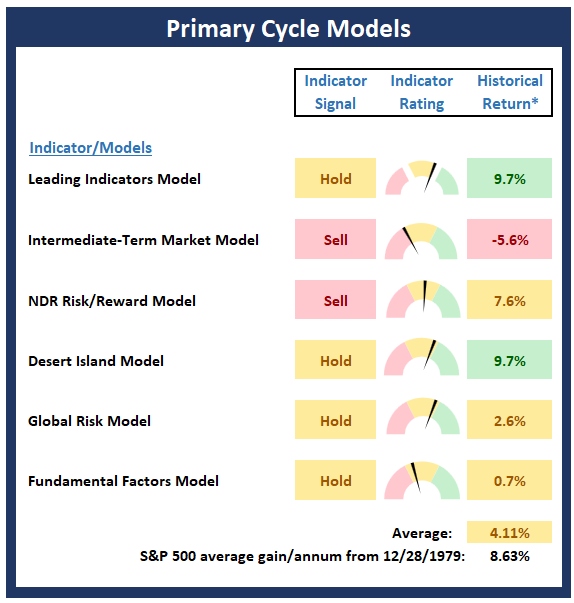
* Source: Ned Davis Research (NDR) as of the date of publication. Historical returns are hypothetical average annual performances calculated by NDR.
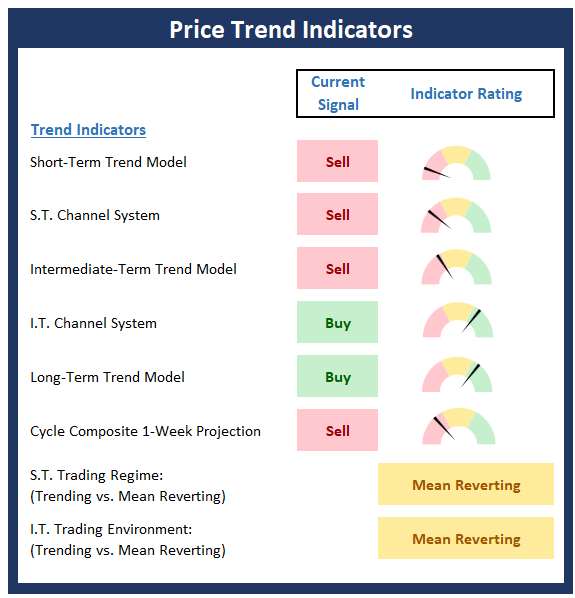
Trend Analysis:
Below are the ratings of key price trend indicators. This board of indicators is designed to tell us about the overall technical health of the market's trend.
Market Momentum Indicators
Below is a summary of key internal momentum indicators, which help determine if there is any "oomph" behind a move in the market.
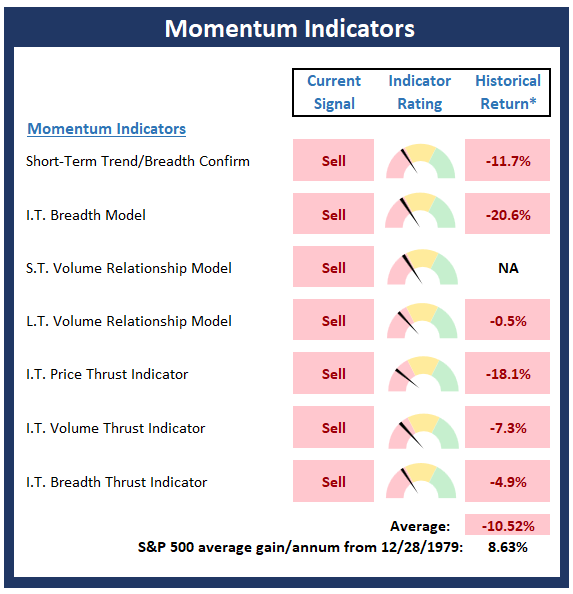
* Source: Ned Davis Research (NDR) as of the date of publication. Historical returns are hypothetical average annual performances calculated by NDR.
Early Warning Indicators
Below is a summary of key early warning indicators, which are designed to suggest when the market may be ripe for a reversal on a short-term basis.
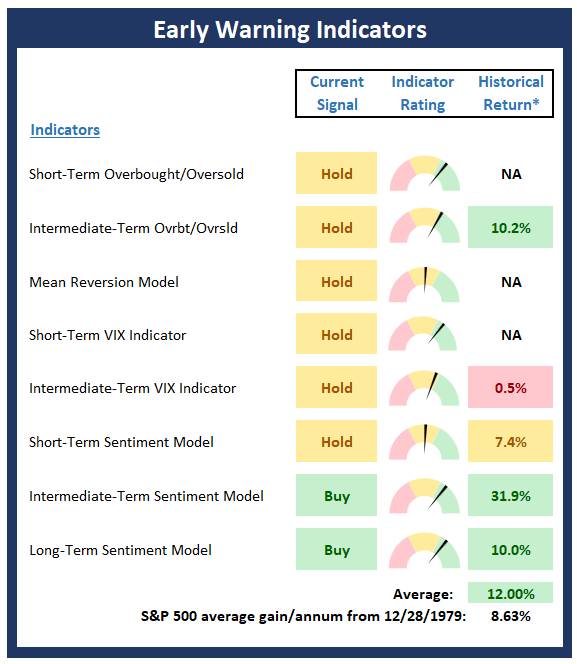
* Source: Ned Davis Research (NDR) as of the date of publication. Historical returns are hypothetical average annual performances calculated by NDR.
Fundamental Factor Indicators
Below is a summary of key external factors that have been known to drive stock prices on a long-term basis.
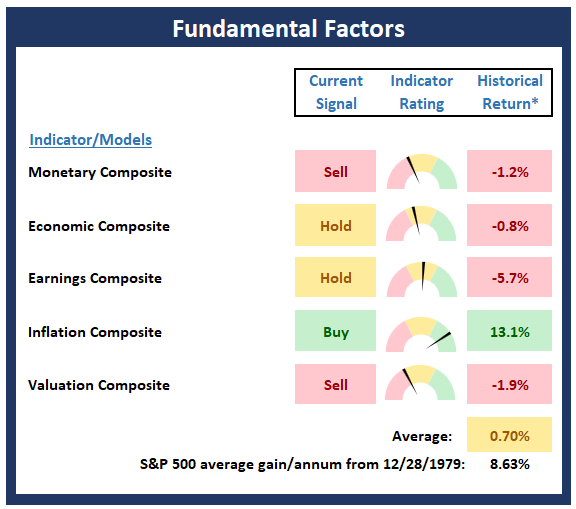
* Source: Ned Davis Research (NDR) as of the date of publication. Historical returns are hypothetical average annual performances calculated by NDR.
Thought for the Day:
When strong winds blow, don't build walls, but rather windmills -Nassim Taleb
Wishing you green screens and all the best for a great day,

David D. Moenning
Founder, Chief Investment Officer
Heritage Capital Research, a Registered Investment Advisor

Disclosures
At the time of publication, Mr. Moenning held long positions in the following securities mentioned: none - Note that positions may change at any time.
NOT INDIVIDUAL INVESTMENT ADVICE. IMPORTANT FURTHER DISCLOSURES