Is It Time To Turn That Frown Upside Down?
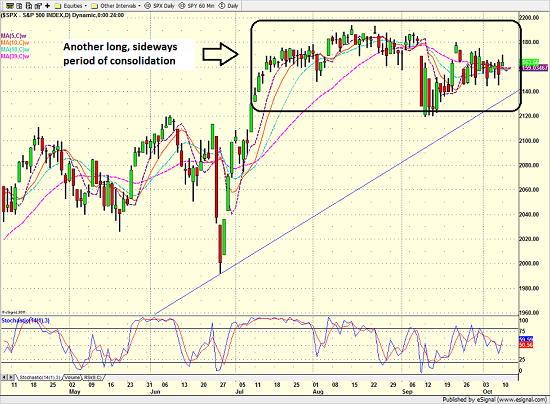
To be sure, the action in the stock market has been sloppy for the better part of three months now. For example, the S&P 500 closed at 2163.75 on July 15 and at 2163.66 yesterday - can you say, sideways?
Yes, there has been some drama along the way as traders have fretted about the German banks, currency movements, interest rates, the Fed, the ECB, the economy, valuations, and of course, the election. Sentiment has become rather dour as almost no one has anything optimistic to say about the outlook for stocks - regardless of the time frame involved.
S&P 500 - Daily 
View Larger Image
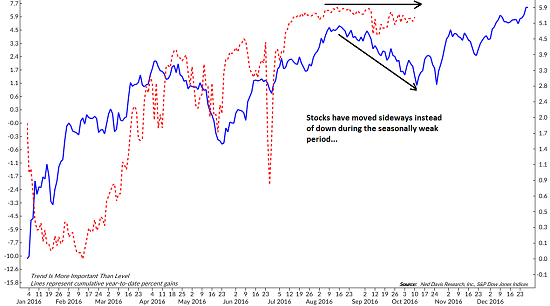
But I think it is also important to recognize that this sideways movement has occurred during what is traditionally a seasonally weak period of time. In other words, stocks have gone sideways instead of down during the mid-August through mid-October time frame. The chart below shows the S&P 500 (blue line) versus the cycle composite (red dashed line). See what I mean?
S&P 500 Daily vs. Cycle Composite 
View Larger Image
For me anyway, this is a reason to be optimistic. After all, there has been no shortage of worries during a period of time when stock normally go down. And yet, here we are - at the exact same spot we were in mid-July - and none the worse for wear.
Lest We Forget...
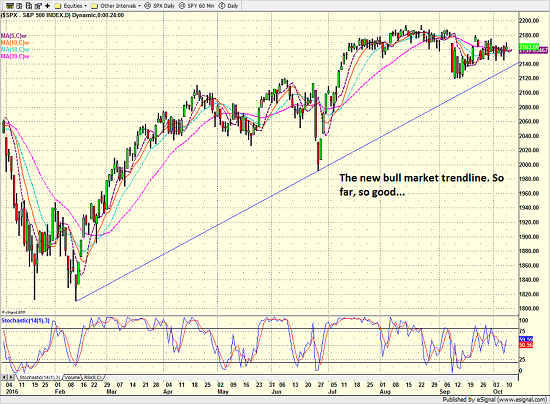
During such a long period of what I might term "misery" in the stock market, it is easy to lose track of the big picture. However, it is also important to recognize that stocks embarked on a new bull market on February 11, 2016.
Since the low on February 11, the Dow Jones Industrial Average has gained +17.04% over a period of 155 days. And with stocks near all-time highs the bears tell us we have nowhere to go but down - especially given the state of the traditional valuation metrics.
However, history might suggest otherwise.
Lest we forget, the current bull market is occurring within the context of a secular bull phase. And going back to 1900, history (and the computers at Ned Davis Research) shows the average gain of such bull markets to be +106.7% over a period of 1027 days.
S&P 500 - Daily 
View Larger Image
Granted, there is no guarantee that this particular market cycle will reflect the averages or even last another week. However, using history as our guide, we can argue that stocks have a long, profitable road ahead of them over the next couple of years.
So, with the cycle composite telling us that stocks are about to start moving higher, it might be time to think about making sure you are aligned for a change in the market's tone in the coming months.
Current Market Drivers
We strive to identify the driving forces behind the market action on a daily basis. The thinking is that if we can both identify and understand why stocks are doing what they are doing on a short-term basis; we are not likely to be surprised/blind-sided by a big move. Listed below are what we believe to be the driving forces of the current market (Listed in order of importance).
1. The State of U.S. Economic Growth
2. The State of Global Central Bank Policies
3. The State of the Earnings Season
3. The State of German/European Banks
Thought For The Day:
The difference between the impossible and the possible lies in a man's determination. -Tommy Lasorda
Wishing you green screens and all the best for a great day,

David D. Moenning
Chief Investment Officer
Sowell Management Services
Looking for a "Modern" approach to Asset Allocation and Portfolio Design?
Looking for More on the State of the Markets?
Investment Pros: Looking to modernize your asset allocations, add risk management to client portfolios, or outsource portfolio design? Contact Eric@SowellManagement.com
Disclosures
The opinions and forecasts expressed herein are those of Mr. David Moenning and may not actually come to pass. Mr. Moenning's opinions and viewpoints regarding the future of the markets should not be construed as recommendations. The analysis and information in this report is for informational purposes only. No part of the material presented in this report is intended as an investment recommendation or investment advice. Neither the information nor any opinion expressed constitutes a solicitation to purchase or sell securities or any investment program.
Any investment decisions must in all cases be made by the reader or by his or her investment adviser. Do NOT ever purchase any security without doing sufficient research. There is no guarantee that the investment objectives outlined will actually come to pass. All opinions expressed herein are subject to change without notice. Neither the editor, employees, nor any of their affiliates shall have any liability for any loss sustained by anyone who has relied on the information provided.
The analysis provided is based on both technical and fundamental research and is provided "as is" without warranty of any kind, either expressed or implied. Although the information contained is derived from sources which are believed to be reliable, they cannot be guaranteed.
David D. Moenning is an investment adviser representative of Sowell Management Services, a registered investment advisor. For a complete description of investment risks, fees and services, review the firm brochure (ADV Part 2) which is available by contacting Sowell. Sowell is not registered as a broker-dealer.
Employees and affiliates of Sowell may at times have positions in the securities referred to and may make purchases or sales of these securities while publications are in circulation. Positions may change at any time.
Investments in equities carry an inherent element of risk including the potential for significant loss of principal. Past performance is not an indication of future results.
Advisory services are offered through Sowell Management Services.
