It's Not The News, But How The Market Reacts...
Dave M. has an early appointment so Paul Schatz of Heritage Capital, LLC is filling in this morning. We are pleased to be able to offer Paul's thoughts on the state of the market and hope that you enjoy his views.
With Monday’s blog and Street$marts being on the long side, I decided to wait a day to offer commentary on how the markets’ reaction to the impending default by Greece, bank closure, referendum, etc. would impact the new month and quarter. To reiterate an important market tenet of mine which has been around for decades, it’s not what the news is, but how the markets react. We are constantly reminded of that with economic news. Is good news bad news for stocks? Is bad news good news? Is good news good news? Is bad news bad news?
I have already written for years that my personal belief is that Greece should leave the Euro. If Greece was the size of Spain or France, the conversation would be very different as those countries are too big to fail and almost too big to save. Greece’s economic output and contribution to the Euro is barely noticeable. Their political system, while democratic, leans heavily socialistic and even more so than most of their European counterparts. Greece has a culture of tax avoidance, fiscal irresponsibility and gross overdependence on the welfare state. It’s not working now; it hasn’t worked in the past; and won’t work in the future. Talk about doing the same thing over and over and over, but expecting different results! That really is insanity!!
Turning to the stock markets, Monday’s negative reaction was for the part, as expected. The longer the “crisis” lasts, the more likely we are to see stocks begin to rally on bad news. That’s something to look for down the road and not here. For now, we have to expect volatility to remain elevated with much of the news occurring in the overnight hours. As such, we should wake up to large moves in the pre-market several times a week.
Getting back to Monday, the Dow plummeted 350 points which sounds like a large number, but keep in mind, it’s only a 2% decline. 2%! And at the end of that day, the Dow had pulled back a little more than 4% from its all-time, intra-day high in May as you can see from the chart below. For months, I have been in the trading camp, looking to buy weakness and sell strength until the March lows were at least breached. Monday’s low revisited those levels almost to the point, a tad disappointing for intermediate-term bulls like myself. I would much rather have seen those levels firmly breached to cause a short-term trap door and shake out some weak handed holders.
At the end of the day on Monday, however, we saw some truly extreme, short-term readings in a host of indicators.
- 90%+ of the volume traded on the New York Stock Exchange was down.
- 99% of the volume in the S&P 500 was down.
- 99% of the stocks in the S&P 500 traded down on the day.
- Less than 10% of S&P 500 stocks were above their 10 day moving average.
- Volume in inverse ETFs spiked as traders hedged and braced for more downside.
- Put/call option ratios soared as investors scrambled for downside protection.
The list goes on and on. Had stocks already been in real decline, you could have argued that Monday was a short-term panic and that the final low was at hand. However, it’s hard to make that case with all-time highs so close. Rather, this pullback looks like yet another single digit bull market decline in a long series during this most hated and disavowed bull market of the modern investing era.
For months, I have been waiting for stock market sentiment to at least get back to neutral from levels we typically see before 10%+ corrections and that’s finally beginning to happen. Although 20,000 has been my next target for some time, I cautioned that it is highly unlikely for that rally to launch with sentiment so skewed to the bullish side for so long.
However, just because we saw extreme readings on Monday doesn’t mean that the ultimate low was seen. I would argue against that. Monday’s snowball day was an important piece, but far from the final piece. Wash out readings like I listed above typically do not coincide with the final low. There is usually more constructive work to be done by price. If history is any guide, a few scenarios open up now as you can see below.
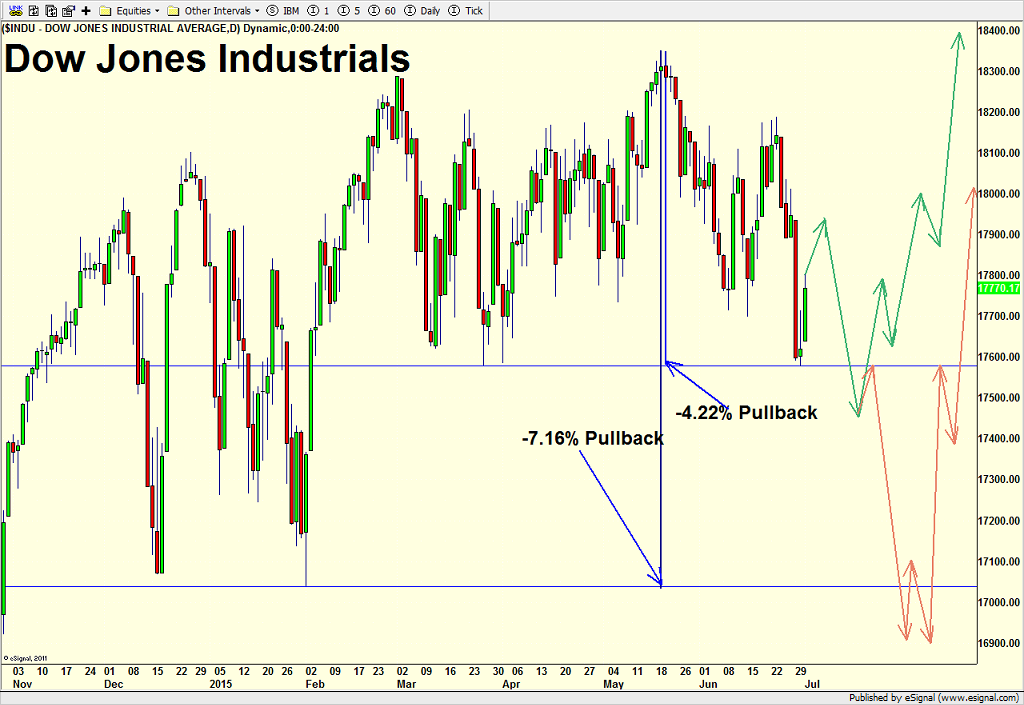
I am going to offer three scenarios in order of likelihood. The first can be seen in green on the right hand side of the chart above. It has the current bounce petering out next week, followed by another decline below Monday’s low where the ultimate bottom is seen. Fresh all-time highs would be seen later this quarter.
The second scenario in orange shows a deeper decline below 17,000 on the Dow, which would probably result in calls that the bull market ended and some nasty, long-term bear market had begun. In fact, I heard one former “1998 guru” proclaim yesterday that the bull market is alive and okay as long as the Dow is above 17,038, but once that “magic” number is closed below, stocks are firmly in a bear market. That’s one of the dumbest comments I have heard in a long while and I certainly hear my fair share of ridiculous statements! As if a single point or points really matter. Give me a break! If the Dow does decline below 17,000 I imagine that bearish sentiment would skyrocket and exceed what we saw at the Ebola bottom in October 2014 and really give the market rocket fuel for a run to 20,000.
The scenario I did not offer on the chart was the most bullish one where stocks already bottomed on Monday and are slowly starting a rally to the upper end of the trading range we have been in since February. While it’s certainly possible, I believe it’s less likely because of the extent of the damage already done. Stocks need some time to repair themselves. Of course, when the market ignores the scenarios I offered and does its own thing, I will respond appropriately.
Summing it all up, Greece is a short-term issue and the news will most likely have the most impact as we sleep. Care more about how the market reacts to news rather than what the news actual is. Watch for spikes in bearish sentiment to set the stage for another leg up in the bull market. The bull market remains old and wrinkly but very much alive.

Paul Schatz
Paul Schatz is President and Chief Investment Officer of Heritage Capital, LLC, in Woodbridge, CT. and a Managing Partner at Numetrix Capital, an investment research firm focused on multi-manager, multi-strategy portfolio solutions.
This Morning's Pre-Game Indicators
Here are the Pre-Market indicators we review each morning before the opening bell...
Major Foreign Markets:
Japan: +0.95%
Hong Kong: +0.12%
Shanghai: -3.47%
London: +0.40%
Germany: +0.04%
France: -0.13%
Italy: -0.46%
Spain: -0.11%
Crude Oil Futures: +$0.25 to $57.21
Gold: -$6.90 at $1162.40
Dollar: lower against the yen, higher vs. euro and pound
10-Year Bond Yield: Currently trading at 2.389%
Stock Indices in U.S. (relative to fair value):
S&P 500: +8.83
Dow Jones Industrial Average: +60
NASDAQ Composite: +19.57
Thought For The Day:
"It vexes me greatly that having to earn my living has forced me to interrupt the work and attend to small matters." -- Leonardo da Vinci
Current Market Drivers
We strive to identify the driving forces behind the market action on a daily basis. The thinking is that if we can both identify and understand why stocks are doing what they are doing on a short-term basis; we are not likely to be surprised/blind-sided by a big move. Listed below are what we believe to be the driving forces of the current market (Listed in order of importance).
1. The State of the Greek Crisis
2. The State of Fed/ECB/PBoC Policy
3. The State of the U.S. Economy
4. The State of Interest Rates
The State of the Trend
We believe it is important to analyze the market using multiple time-frames. We define short-term as 3 days to 3 weeks, intermediate-term as 3 weeks to 3 months, and long-term as 3 months or more. Below are our current ratings of the three primary trends:
Short-Term Trend: Moderately Negative
(Chart below is S&P 500 daily over past 1 month)
Intermediate-Term Trend: Moderately Positive
(Chart below is S&P 500 daily over past 6 months)
Long-Term Trend: Positive
(Chart below is S&P 500 daily over past 2 years)
Key Technical Areas:
Traders as well as computerized algorithms are generally keenly aware of the important technical levels on the charts from a short-term basis. Below are the levels we deem important to watch today:
- Key Near-Term Support Zone(s) for S&P 500: 2055
- Key Near-Term Resistance Zone(s): 2100
The State of the Tape
Momentum indicators are designed to tell us about the technical health of a trend - I.E. if there is any "oomph" behind the move. Below are a handful of our favorite indicators relating to the market's "mo"...
- Trend and Breadth Confirmation Indicator (Short-Term): Negative
- Price Thrust Indicator: Negative
- Volume Thrust Indicator: Negative
- Breadth Thrust Indicator: Neutral
- Intermediate-Term Bull/Bear Volume Relationship: Moderately Negative
- Technical Health of 100+ Industry Groups: Moderately Positive
The Early Warning Indicators
Markets travel in cycles. Thus we must constantly be on the lookout for changes in the direction of the trend. Looking at market sentiment and the overbought/sold conditions can provide "early warning signs" that a trend change may be near.
- S&P 500 Overbought/Oversold Conditions:
- Short-Term: Oversold
- Intermediate-Term: Oversold - Market Sentiment: Our primary sentiment model is Neutral .
The State of the Market Environment
One of the keys to long-term success in the stock market is stay in tune with the market's "big picture" environment in terms of risk versus reward.
- Weekly Market Environment Model Reading: Neutral
The opinions and forecasts expressed herein are those of Mr. Paul Schatz and may not actually come to pass. Mr. Schatz's opinions and viewpoints regarding the future of the markets should not be construed as recommendations. The analysis and information in this report is for informational purposes only. No part of the material presented in this report is intended as an investment recommendation or investment advice. Neither the information nor any opinion expressed nor any Portfolio constitutes a solicitation to purchase or sell securities or any investment program.
Any investment decisions must in all cases be made by the reader or by his or her investment adviser. Do NOT ever purchase any security without doing sufficient research. There is no guarantee that the investment objectives outlined will actually come to pass. All opinions expressed herein are subject to change without notice. Neither the editor, employees, nor any of their affiliates shall have any liability for any loss sustained by anyone who has relied on the information provided.
The analysis provided is based on both technical and fundamental research and is provided "as is" without warranty of any kind, either expressed or implied. Although the information contained is derived from sources which are believed to be reliable, they cannot be guaranteed.
Paul Schatz, an advisor representative of CONCERT Wealth Management Inc. (CONCERT), is founder of Heritage Capital LLC, a legal business entity(Heritage). Advisory services are offered through CONCERT Wealth Management, Inc., an SEC registered investment advisor. For a complete description of investment risks, fees and services review the CONCERT firm brochure (ADV Part 2) which is available from your Investment Representative or by contacting Heritage or CONCERT.
Heritage Capital a state-registered investment adviser. Heritage also serves as a sub-advisor to other investment advisory firms. Neither Heritage or CONCERT is registered as a broker-dealer.
Employees and affiliates of Heritage may at times have positions in the securities referred to and may make purchases or sales of these securities while publications are in circulation. Editors will indicate whether they or Heritage has a position in stocks or other securities mentioned in any publication. The disclosures will be accurate as of the time of publication and may change thereafter without notice.
Investments in equities carry an inherent element of risk including the potential for significant loss of principal. Past performance is not an indication of future results.