Keep It Out Of The Ditch

Don't look now fans but it's been a month since the S&P 500 made a fresh new low for this bear market cycle. Yep, that's right, investors haven't had the bejeebers scared out of them nor been forced to face the discouraging stats regarding the degree of index declines since June 16th. Mark it on the calendar.
Of course, this does not mean that the market won't make a new low. No, the status of the Fed's hiking path, the economic cycle, and corporate earnings will likely determine whether or not the low is in. However, the first thing that must happen in order for a bear market to morph into a bull is for the major indices to stop going down. And given the raft of bad news lately, the fact that stocks haven't cratered and/or lurched into a new leg down is a good thing. Well, from my seat anyway.
Don't get me wrong. I'm not suggesting that everything is hunky dory now or that it will be smooth sailing from here. Just the opposite, really. I expect the bottoming process to be a long slog, full of fits and starts as investors try to get a handle on the outlook for the future.
Most important in this process will be determining what's being called the Fed's "terminal point." As in, when Jerome Powell's merry band of central bankers will say "no mas" to rate hikes. And whether or not the economy, the consumer, and corporate earnings are still standing when Powell & Co. do eventually call it quits.
Put another way, the key question right now is if the economy can stay out of the ditch while the Fed is putting the pedal to the metal on the rate hike accelerator.
The bulls argue that the consumer will remain resilient and ultimately win the day. After all, they've got cash in the bank, jobs are plentiful, and the value of their homes is up a bunch. Thus, a little thing called the wealth effect should keep the economy moving forward. Our heroes in horns also point to the fact that, according to history, if the economy does not enter a real recession, bear market declines tend to bottom out after a decline in the low 20's. And since the S&P 500 was down -23.5% at it's low, the argument can be made that the next big move ought to be up, not down.
Now toss in the idea that many analysts expect inflation to peak soon (if it hasn't already) and that there are a bunch of reasons to expect prices of all kinds of things to start falling and well, one can't be faulted for looking ahead to brighter days. And for stock market investors, this means buying stocks for the future. Yes, here and now. As long as you have a reasonable time frame, of course.
However, our furry friends in the bear camp have a few arguments of their own these days. There's the fact that the economy is appears to be deteriorating at a surprising fast rate. And that inflation has not peaked (last week's CPI/PPI reads were the highest in 40+ years). And that the money supply's rate of change is now negative (traditionally a precursor to recession). And the yield curve is inverted (ditto). And that the dollar continues to rise (this hurts earnings of multinationals based in U.S.). And that the Small Business Outlook reading is now the lowest in history. And that home prices could pull back. And that the economic slowdown looks worse outside of the U.S. (anybody see China's economic data last week?) The collapse in crypto. Russia's insane war. And of course, COVID.
So... It would appear that both teams have some pretty good arguments these days. And from my perch, this explains why stock and bonds prices haven't kept falling. It is the "argument" between the two teams that is keeping stock prices from moving lower (or meaningfully higher). And my thinking is that this is what we can expect to see for a while. A stalemate of sorts where headlines that favor the bulls (such as Friday's Retail Sales, UofM Sentiment, and Empire Manufacturing reports) create a nice rally and vice versa.
While I'm just spit balling here, I'm of the mind that this type of sideways, up-and-down, back and forth action is likely to persist until we can be sure that the Fed isn't going to send the economy careening off the road at high speed. My thought is that we won't see the bulls really come to life until investors can be pretty darn sure that the inevitable economic slowdown doesn't pick up steam. That any recession is merely "technical" in nature - as in, is short and sweet.
If and when we can get comfortable that the Fed isn't going to wreck the economy as they barrel down the rate hike road, then, and only then, can investors start to look ahead and buy with both hands. Until then, I'd expect to see a period of consolidation which include a series of rallies and retraces. And if things start to look up, perhaps even a "higher high and a higher low" along the way. Fingers crossed.
Publishing Note: I will be traveling next week and will not publish a report.
Now let's review the "state of the market" through the lens of our market models...
The Big-Picture Market Models
We start with six of our favorite long-term market models. These models are designed to help determine the "state" of the overall market.
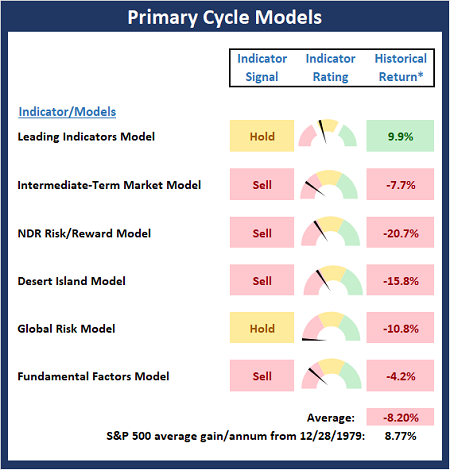
* Source: Ned Davis Research (NDR) as of the date of publication. Historical returns are hypothetical average annual performances calculated by NDR.
The Fundamental Backdrop
Next, we review the market's fundamental factors including interest rates, the economy, earnings, inflation, and valuations.
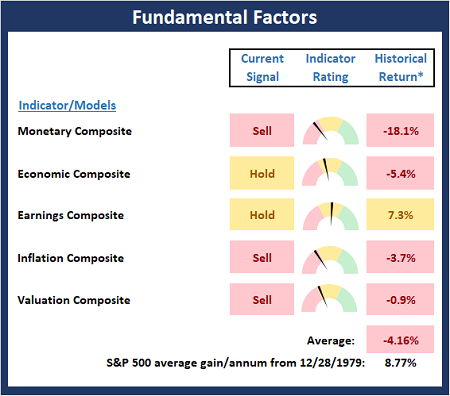
* Source: Ned Davis Research (NDR) as of the date of publication. Historical returns are hypothetical average annual performances calculated by NDR.
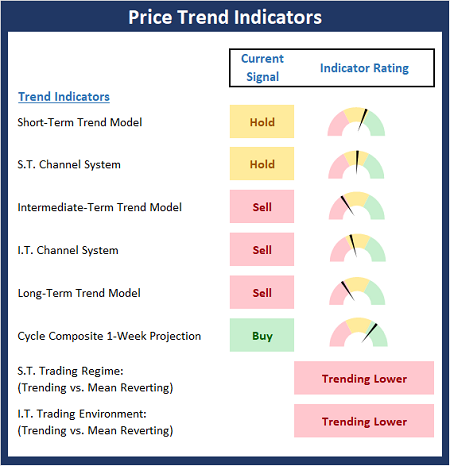
The State of the Trend
After reviewing the big-picture models and the fundamental backdrop, I like to look at the state of the current trend. This board of indicators is designed to tell us about the overall technical health of the market's trend.
The State of Internal Momentum
Next, we analyze the momentum indicators/models to determine if there is any "oomph" behind the current move.
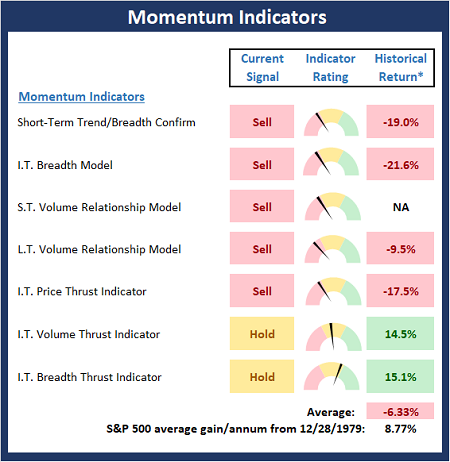
* Source: Ned Davis Research (NDR) as of the date of publication. Historical returns are hypothetical average annual performances calculated by NDR.
Early Warning Indicators
Finally, we look at our early warning indicators to gauge the potential for countertrend moves. This batch of indicators is designed to suggest when the table is set for the trend to "go the other way."
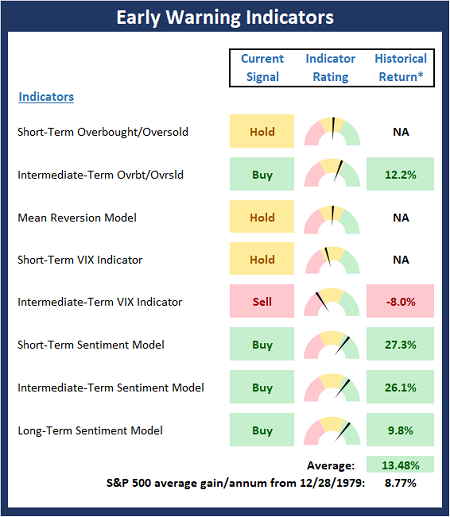
* Source: Ned Davis Research (NDR) as of the date of publication. Historical returns are hypothetical average annual performances calculated by NDR.
Thought for the Day:
Be not afraid of going slowly, be afraid only of standing still. -Chinese Proverb
Wishing you green screens and all the best for a great day,

David D. Moenning
Founder, Chief Investment Officer
Heritage Capital Research, a Registered Investment Advisor

Disclosures
At the time of publication, Mr. Moenning held long positions in the following securities mentioned: None - Note that positions may change at any time.
NOT INDIVIDUAL INVESTMENT ADVICE. IMPORTANT FURTHER DISCLOSURES