Looking Ahead to Better Days?

With stocks enjoying a pretty solid rally of late, many investors are likely wondering why the mood has changed at the corner of Broad and Wall. Oh, and of course, if the rally will amount to anything more than a bounce in an ongoing bear market.
While we can't know the answer to the second question without a healthy dose of hindsight, we can try to understand the drivers behind the market's most recent mood swings.
From my seat, stocks are movin' on up based on the idea that we've seen the peaks in inflation and, in turn, Fed hawkishness. In other words, managers are putting some of their cash stockpile to work in the hope that the worst of the inflation surge and the Fed's fight is behind us.
As such, the bottom line is if you are a fund manager looking out over the next year, this seems like an okay spot to start adding positions.
To be clear, I am not "calling" the bottom of this bear market. And frankly, I'm not sure whether the ultimate low of this bear has been seen. Nor am I suggesting that stocks will only move higher from here. No, with my crystal ball back in the shop (again!), I don't have a lot of confidence in making a big call here.
However, if you are investor - and not a fast-money trader - the idea of putting money back in the market after a tough ten-month stretch certainly makes sense. If you are in the game for the long-term, then buying when there is blood in the streets has proved to be a pretty successful strategy over the years.
Using such an approach won't get you the bottom - and in my experience almost nothing will with any degree of consistency. But buying your favorite merchandise after it's fallen a lot usually pays off. As long as your time frame is appropriate, of course!
So, why are managers been buying? Why is money coming back into the game? In short, because if one digs into the components of inflation, the conclusion is that prices "should" be heading down in the not too distant future.
For example, below are two charts from last week's S&P Global's Services report. The top clip shows the input prices to the services sector. This is the cost of providing a service. Note the direction of the trend - it's down.
Then below that is the chart of what service providers charged to their customers. Note that the direction of this chart is also down.
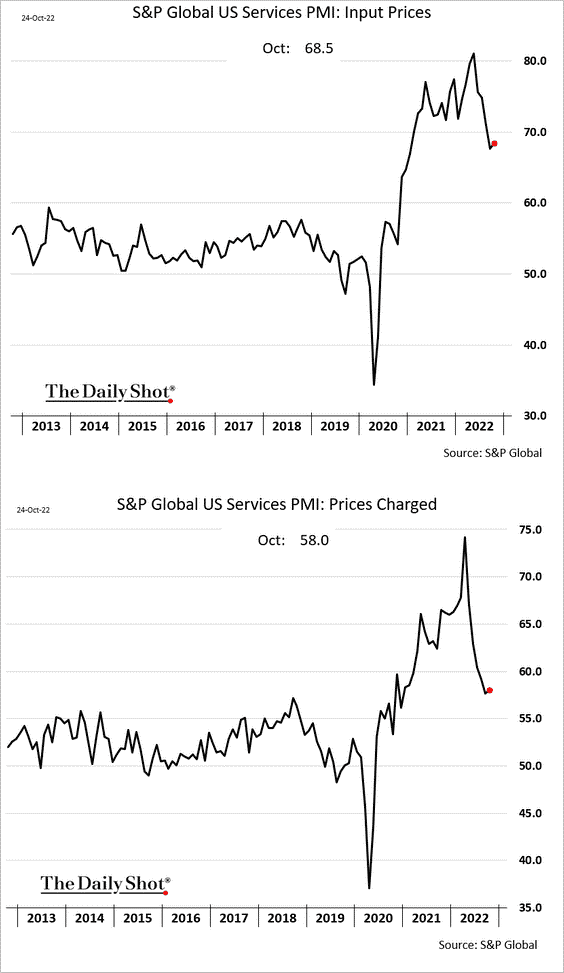
Image Source: The Daily Shot
So, with the services sector accounting for something on the order of 70% of the US economy, one can argue that costs are moving in the right direction.
Another big component of inflation is the cost of housing. Of which, rents are a major factor - and a big reason that inflation measures have stayed "sticky."
However, as the chart below shows, rent increases are also trending lower. Thus, one can argue that these inputs into the inflation formulas should also start to improve.
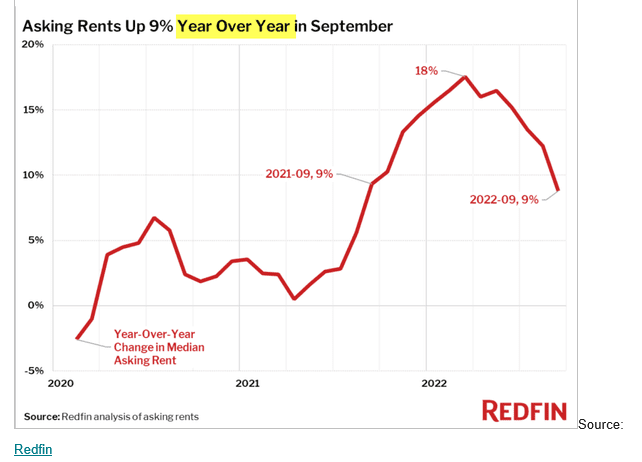
Image Source: The Daily Shot
Why hasn't it improved already, you ask? Cutting to the chase, because of the way the government calculates housing costs in its CPI/PPI statistics. You see, there is a rather substantial lag between the time costs change and when they show up in the indices.
So, given that rents - or at least the increases in rents - have been falling for some time now, it makes sense that this trend should also start to show up in the inflation numbers soon.
Lest we forget, the stock market is a discounting mechanism of future expectation. So, at this stage of the game, the market appears to be "sniffing out" the peak in inflation. And in turn, the peak in the Fed's inflation fight.
As such, some investors are thinking that this isn't a bad time to invest some of that cash they have on the sidelines.
Time will tell. But for now, there is enough "oomph" and breadth behind the recent move that some of our momentum indicators are sitting up and taking notice.
Now if we can only get Jay Powell to talk nice this week, we'd be in business. However, I'm not holding my breath on that one at the moment. Yes, at some point, the Fed will announce that they are taking their foot off the gas. And many investors believe this will be the ultimate "all clear" signal.
But until the Fed actually does "pivot," investors will have to look ahead and decide if things will look better or worse six months from now.
Now let's review the "state of the market" through the lens of our market models...
The Big-Picture Market Models
We start with six of our favorite long-term market models. These models are designed to help determine the "state" of the overall market.
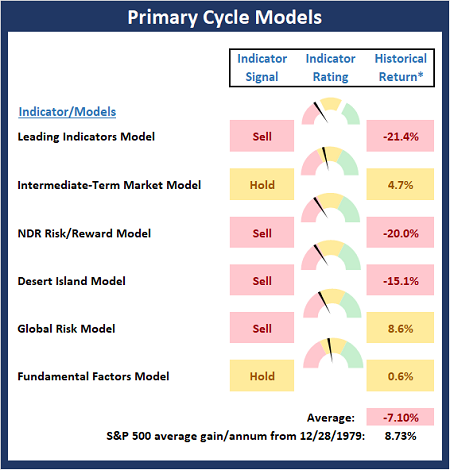
* Source: Ned Davis Research (NDR) as of the date of publication. Historical returns are hypothetical average annual performances calculated by NDR.
The Fundamental Backdrop
Next, we review the market's fundamental factors including interest rates, the economy, earnings, inflation, and valuations.
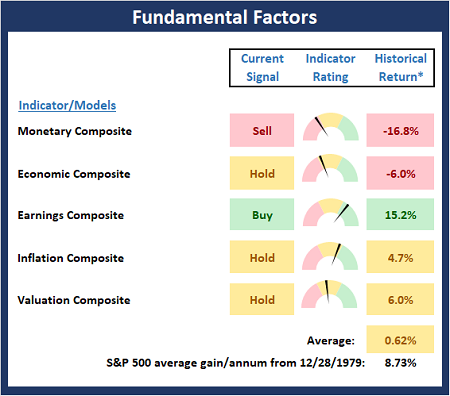
* Source: Ned Davis Research (NDR) as of the date of publication. Historical returns are hypothetical average annual performances calculated by NDR.
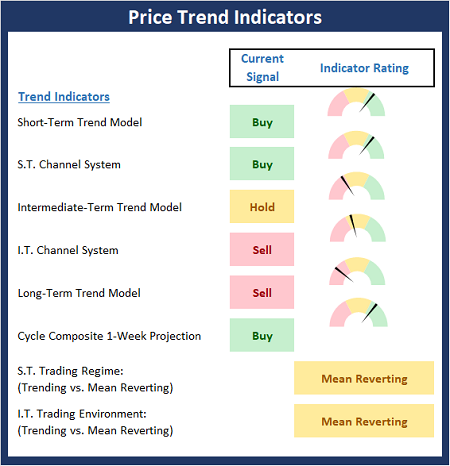
The State of the Trend
After reviewing the big-picture models and the fundamental backdrop, I like to look at the state of the current trend. This board of indicators is designed to tell us about the overall technical health of the market's trend.
The State of Internal Momentum
Next, we analyze the momentum indicators/models to determine if there is any "oomph" behind the current move.
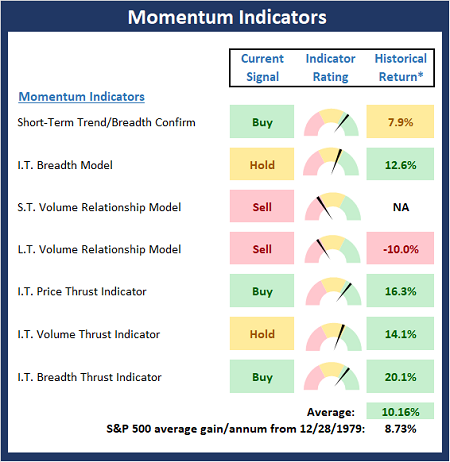
* Source: Ned Davis Research (NDR) as of the date of publication. Historical returns are hypothetical average annual performances calculated by NDR.
Early Warning Indicators
Finally, we look at our early warning indicators to gauge the potential for countertrend moves. This batch of indicators is designed to suggest when the table is set for the trend to "go the other way."
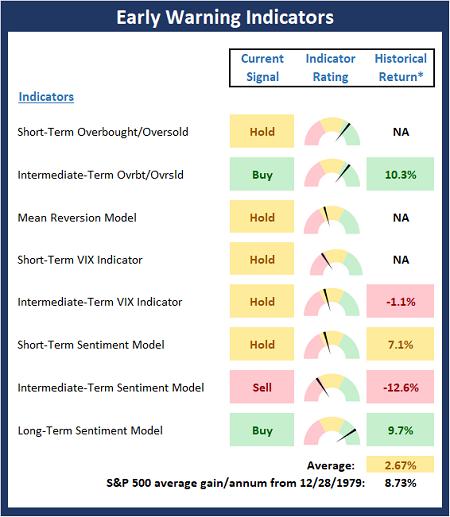
* Source: Ned Davis Research (NDR) as of the date of publication. Historical returns are hypothetical average annual performances calculated by NDR.
Thought for the Day:
You are in charge of how you feel -Unknown
Wishing you green screens and all the best for a great day,

David D. Moenning
Founder, Chief Investment Officer
Heritage Capital Research, a Registered Investment Advisor

Disclosures
At the time of publication, Mr. Moenning held long positions in the following securities mentioned: None - Note that positions may change at any time.
NOT INDIVIDUAL INVESTMENT ADVICE. IMPORTANT FURTHER DISCLOSURES