Making Sense of the Mayhem

Talk about a wild week. Normally I am loathe to recount the happenings in the markets of any calendar period as I find the exercise a bore. But given the rollercoaster ride investors were treated to last week, I think it is important to understand why Ms. Market acted the way she did.
Although traders closed out the week with a gut-wrenching decline of -2.8% for the S&P 500 and a -3.9% plunge over on the NASDAQ 100, you may be surprised to learn that the major indices actually finished up for the week. Thanks in no small part to one of the best two-day rallies seen in some time to start the week, of course.
But by week's end, the upbeat mood seen on Monday and Tuesday had been replaced with massive sell programs and a general feeling of despair as the S&P finished just above its bear market lows.
To be sure, such extreme mood/price swings in the market don't happen often. So, I thought it might be a good idea to rewind the tape and see if we can't make some sense of the volatility. But remember, our job here is not to pass judgement on whether we think the market is right or wrong but rather to understand the reasoning behind the action.
The Week Started Strong
On Monday morning, investors were treated to a boatload of green in the futures market. Given that the Friday prior had ended in a flush to new lows for the cycle, this was definitely good to see. But the logical question come Monday morning was, why were stocks and bond prices rallying after basically collapsing on Friday?
The answer came from across the pond as UK Prime Minister Liz Truss reversed course on her tax cut plan. If you will recall, Truss had been channeling her inner Ronald Regan and hoping to kick-start the economy by cutting taxes. However, the plan wasn't "funded" by anything and as a result, the "bond vigilantes" started howling - and selling.
Before you could determine the last time the British Pound had been at parity with the US dollar, things started "breaking" across the pond. As in the UK government bond market. And, of course, the country's currency.
With the "Gilt" market on the verge of collapse due to systematic selling likely to occur in response to the big dive in UK bond prices, the Bank of England (BoE) brought out their "bazooka" and told anyone and everyone listening that they would buy an "unlimited" amount of bonds to restore order to the market.
The funny thing about a central bank "bazooka" is it doesn't actually need to be fired to be effective. NO, it just has to be loaded up and waved about to show sellers they mean business.
So, when PM Truss did a U-turn and backed away from the tax cut plan over the weekend, suddenly all was right with the world again. Stocks and bonds rallied, and it looked like the crisis had been averted.
Then on Tuesday, the bulls were treated to what they thought was a really big deal. Some called it a turning point. A game changer if you will. You see, the Royal Bank of Australia decided to increase rates by 25 basis points instead of the 50 bps markets had been expecting. What's more, RBA Governor Phillip Lowe said the country’s cash rate has been raised "substantially in a short period of time." This seemed to indicate that enough was about to be enough.
Bam. Traders viewed the move and Lowe's comments as a sign that central bankers would soon begin to taper their uber aggressive hiking plans. Just like that, the "pivot" narrative was back - in a big way.
Stocks surged on the news. The basic thinking was that central bankers had come to their senses. After almost breaking the UK bond market, surely the Fed would take note of the wrecking ball they were wielding and start talking about tapering their rate hike plans. In short, markets breathed a collective sigh of relief as maybe, just maybe, the end might be in sight.
Fed Sticks to the Script
However, by Wednesday afternoon, it became clear that the RBA had acted alone. There was no global coordination. In fact, NY Fed President Williams went the other way saying rates were "not yet in a restrictive place" and the Fed "still has a significant ways to go" to get there. And when asked about the idea of rate cuts next year, San Francisco Fed President Mary Daly said, "I don’t see that happening at all."
So, once again, the Fed went out of its way to push back hard on the idea of pausing anytime soon, to say nothing of the idea that rates could actually be cut in the future. No, FOMC members stuck to their hardline inflation-fighting script.
To say markets were disappointed would be an understatement. Whether they truly don't care about what the consequences (known and unknown) of their actions it or were just jawboning, the Fed basically said they were going to keep hiking rates until inflation came down, regardless of what happens to markets, currencies, and/or the economies of the world.
The Negatives Return
Now toss in the negative preannouncements from the likes of Ford (F), FedEx (FDX), Nike (NKE), Apple (AAPL), Micron (MU), Levi's (LEVI), Advanced Micro (AMD), and Samsung, and by Thursday afternoon hope was fading - and fast.
Then came Friday's jobs report. While the headline Nonfarm Payrolls were only modestly above expectations at 263K versus 250K and represented a drop from August's robust 315K total, the Unemployment Rate was significantly better than economists had expected, falling to 3.5% from 3.7%.
Good News is Bad
Isn't this good news, you may ask. After all, falling unemployment is a sign of a healthy economy. And when coupled with Wednesday's ISM Services PMI report, which showed that activity is expanding at a robust pace, the combo makes it pretty clear the economy is NOT in recession at the present time. Good stuff, right?
Not exactly. As you are likely aware, "market logic" isn't always so. In this case, the markets are entrenched in a "good news is bad news" environment for the simple reason that good economic news means the Fed can keep its foot to the floor on the rate hiking gas pedal. Whereas bad news means the Fed would have to start tapering their rate hike campaign. And really bad news would lead to rate cuts. Capice?
From there, the sell algos took over. And while there is a growing number of analysts that believe values are developing in this market, when stocks start plunging on a Friday, even those looking to buy simply stand aside to wait for the dust to settle.
So, there you have it. A week that began very green ended very red. Ugh.
The Question of the Day
The question of the day from a trading perspective is if we are seeing another technical "test" of the lows, which would represent an argument for this being a basing phase, or the start of a new leg down.
If you are hoping for the former, you'd like to see things stabilize in the near term on lower volume and reduced volatility. You'd like to see some rally attempts last for more than a day or two. And you'd like to see improving breadth statistics, which would suggest that both teams are participating in the game. One can hope, right?
Now let's review the "state of the market" through the lens of our market models...
The Big-Picture Market Models
We start with six of our favorite long-term market models. These models are designed to help determine the "state" of the overall market.
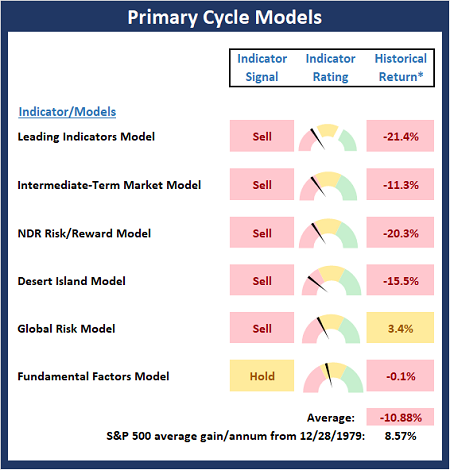
* Source: Ned Davis Research (NDR) as of the date of publication. Historical returns are hypothetical average annual performances calculated by NDR.
The Fundamental Backdrop
Next, we review the market's fundamental factors including interest rates, the economy, earnings, inflation, and valuations.
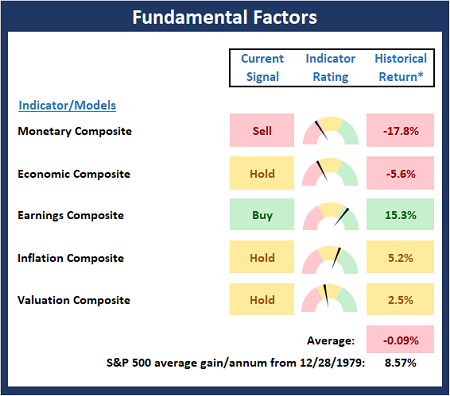
* Source: Ned Davis Research (NDR) as of the date of publication. Historical returns are hypothetical average annual performances calculated by NDR.
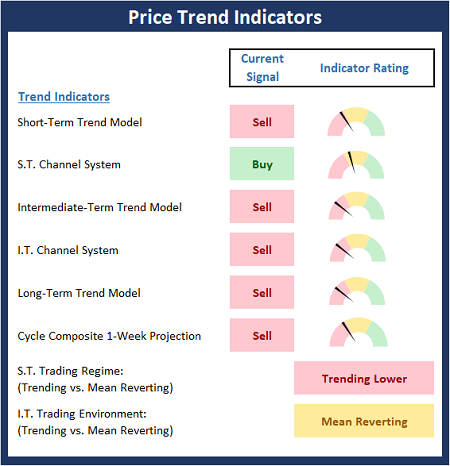
The State of the Trend
After reviewing the big-picture models and the fundamental backdrop, I like to look at the state of the current trend. This board of indicators is designed to tell us about the overall technical health of the market's trend.
The State of Internal Momentum
Next, we analyze the momentum indicators/models to determine if there is any "oomph" behind the current move.
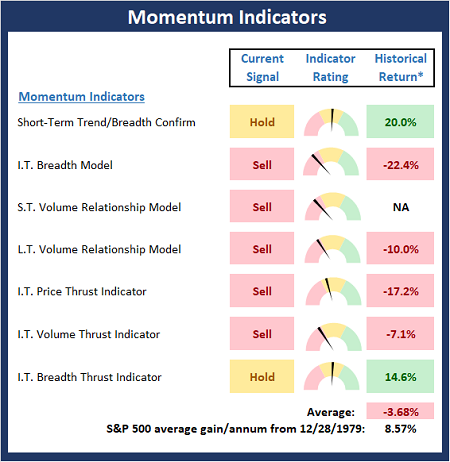
* Source: Ned Davis Research (NDR) as of the date of publication. Historical returns are hypothetical average annual performances calculated by NDR.
Early Warning Indicators
Finally, we look at our early warning indicators to gauge the potential for countertrend moves. This batch of indicators is designed to suggest when the table is set for the trend to "go the other way."
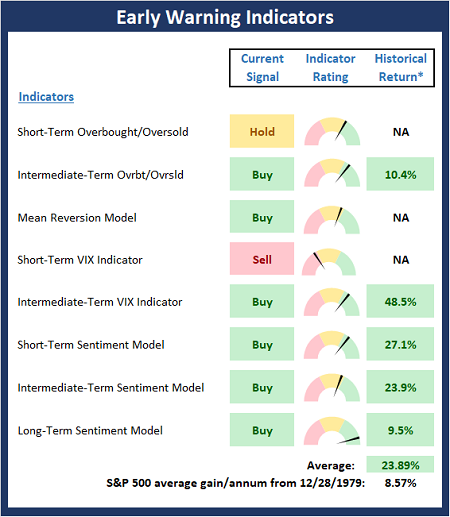
* Source: Ned Davis Research (NDR) as of the date of publication. Historical returns are hypothetical average annual performances calculated by NDR.
Thought for the Day:
Happiness is when what you think, what you say, and what you do are in harmony. -Mahatma Gandhi
Wishing you green screens and all the best for a great day,

David D. Moenning
Founder, Chief Investment Officer
Heritage Capital Research, a Registered Investment Advisor

Disclosures
At the time of publication, Mr. Moenning held long positions in the following securities mentioned: AAPL, SPY - Note that positions may change at any time.
NOT INDIVIDUAL INVESTMENT ADVICE. IMPORTANT FURTHER DISCLOSURES