Market Model Review and Publishing Update

Greetings and Happy Sunday!
I am writing to let you know that I've decided to make an adjustment to the publishing schedule of my blog/oftentimes meandering market missive.
Going forward, I plan to publish a "Model Review" report on Monday mornings. This will be the same group of models that you have come to know over the years. The idea is to start the week with a quick check on the key market models/indicator boards in order to try and stay in tune with the state of the indicators.
In addition, I plan to provide our view of the primary market drivers (aka, "The State of the Market" report) in a separate post as time permits, to be published mid-week.
The reason for the change is with my Monday morning workload/research, I have often struggled to get a market missive published.
I hope you enjoy the new report schedule and I now return you to your regularly scheduled weekend. Go Team USA to win back the Ryder Cup!
The Big-Picture Market Models
We start with six of our favorite long-term market models. These models are designed to help determine the "state" of the overall market.
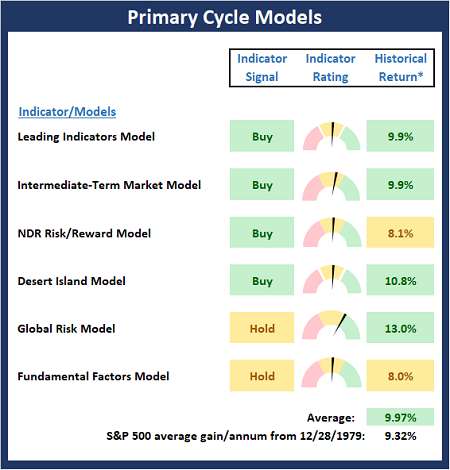
* Source: Ned Davis Research (NDR) as of the date of publication. Historical returns are hypothetical average annual performances calculated by NDR.
The Fundamental Backdrop
Next, we review the market's fundamental factors including interest rates, the economy, earnings, inflation, and valuations.
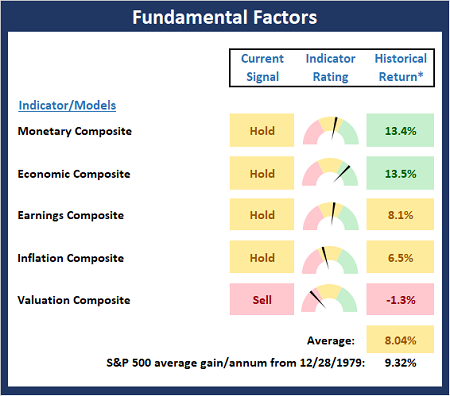
* Source: Ned Davis Research (NDR) as of the date of publication. Historical returns are hypothetical average annual performances calculated by NDR.
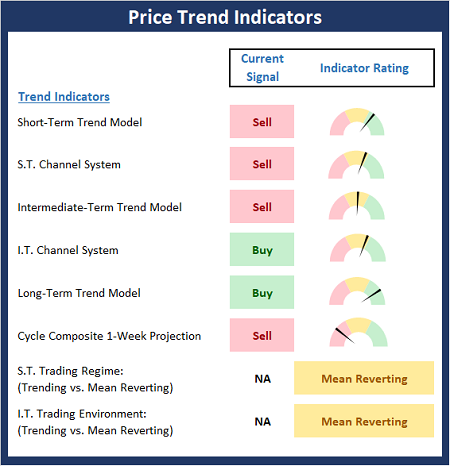
The State of the Trend
After reviewing the big-picture models and the fundamental backdrop, I like to look at the state of the current trend. This board of indicators is designed to tell us about the overall technical health of the market's trend.
The State of Internal Momentum
Next, we analyze the momentum indicators/models to determine if there is any "oomph" behind the current move.
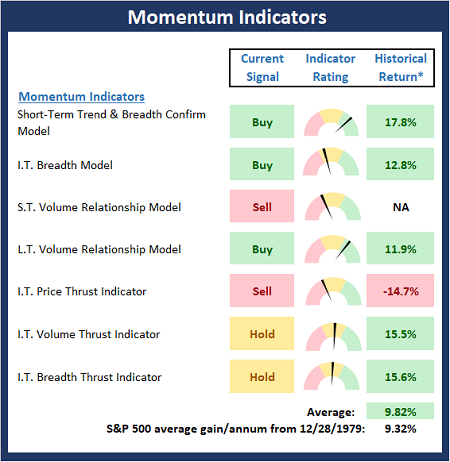
* Source: Ned Davis Research (NDR) as of the date of publication. Historical returns are hypothetical average annual performances calculated by NDR.
Early Warning Signals
Finally, we look at our early warning indicators to gauge the potential for counter-trend moves. This batch of indicators is designed to suggest when the table is set for the trend to "go the other way."
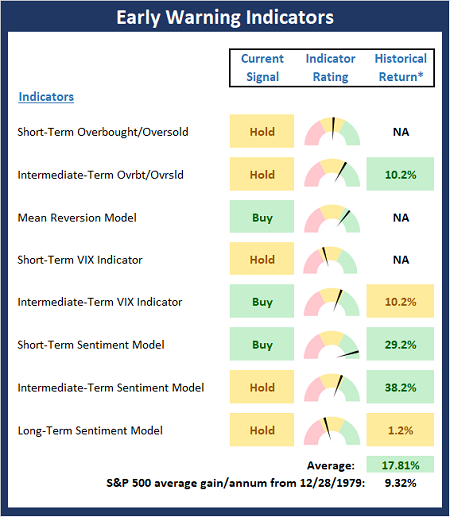
* Source: Ned Davis Research (NDR) as of the date of publication. Historical returns are hypothetical average annual performances calculated by NDR.
Thought for the Day:
"You can't pay back - you can only pay forward." --Woody Hayes
Wishing you green screens and all the best for a great day,

David D. Moenning
Founder, Chief Investment Officer
Heritage Capital Research, a Registered Investment Advisor

Disclosures
At the time of publication, Mr. Moenning held long positions in the following securities mentioned: None - Note that positions may change at any time.
NOT INDIVIDUAL INVESTMENT ADVICE. IMPORTANT FURTHER DISCLOSURES