Markets Rethinking The Outlook

From my seat, the key driver to the current action in the stock market remains the spike in bond yields. This morning's early dance to the downside represents an exclamation point on this concept. In short, yields are breaking out to new highs for the current cycle, and stocks are following the direction of bond prices. Down. Hard.
The questions of the day then would appear to be, why are rates rising so fast and why do stocks care so much?
The easy answer - and perhaps the most succinct one - is yields are surging as investors reprice bonds for (a) the ongoing rise in inflation and (b) the Fed's newly found penchant for fighting" the "inflation problem."
If you will recall, the "problem" with inflation until just recently had been that the rate of inflation has remained stubbornly below the Fed's 2% target - for more than a decade. But with all the COVID-induced disruptions causing almost unprecedented price increases and all sorts of other difficulties, the Fed recently did an about-face on the subject. So, suddenly, the Fed is worried about getting inflation back down to their target level. And a batch of Fed officials have been talking about using any/all of the tools at their disposal to do so.
Never mind that today's inflation problem is NOT a replay of the early 1980's (IMO, of course). Never mind the idea that higher rates are not going to get those out sick back to work - or fix the supply chain issues. Nope, it looks like the Fed is going to use the only tools they've got by raising rates and reducing their balance sheet faster than markets had expected. And markets are adjusting to this new world.
Omicron also comes into play in a pretty big way here. While it is positive that the latest COVID-19 variant doesn't appear to cause severe illness, hospitalizations/deaths in the majority of the vaccinated/boosted crowd, the turbo-charged rate of transmission is causing anyone with symptoms to stay home and isolate. The problem here is that since SO MANY workers are calling in sick, the "supply chain" theme is back - in a big way. And the key appears to be that a great many businesses just don't have enough staff right now to provide service or make stuff to sell.
Extrapolating this out causes analysts to fret about a few things, including more inflation issues and a possible slowdown in economic growth/earnings. My take is this is not a combination that favors stocks. While some scientists suggest that Omicron could burn out quickly and as such, the current problems could very well be short-term in nature, traders remain on high alert for anything that could put a dent in growth - or cause the Fed to become even more antagonistic.
So, with expectations for inflation on the rise and the outlook for growth heading the other direction, a "correction" in prices certainly makes some sense.
Thus, the premiums that were paid for those big growth names are falling. In turn, anything that is considered to be richly valued is being sold. And those speculative names that were all the rage last year are this year's market punching bags. While it may sound impossible, Ned Davis Research reports that nearly 40% of the NASDAQ's constituents are down at least 40% from their 52-week highs. Ouch.
In sum, the market is having what I call a "re-think" about expectations going forward. Gone is the idea that the economy will grow at a healthy clip. Now there are worries about growth, inflation, and a Fed mistake. Therefore, some additional price exploration to the downside looks to be the path of least resistance.
Well, until traders feel this move becomes overdone, of course. From there, we can probably expect a violent mean-reversion bounce to the upside. But from my seat, it doesn't look like we're there yet. Stay tuned.
Now let's review the "state of the market" through the lens of our market models...
The Big-Picture Market Models
We start with six of our favorite long-term market models. These models are designed to help determine the "state" of the overall market.
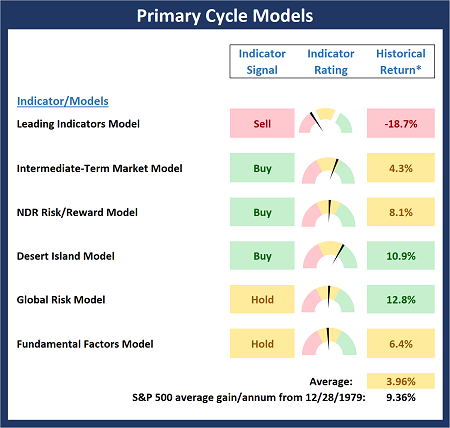
* Source: Ned Davis Research (NDR) as of the date of publication. Historical returns are hypothetical average annual performances calculated by NDR.
Current Take: Big Picture Models
There is an important change to the Primary Cycle Board to report this week as the Leading Indicators Model flashed a Sell signal. Taken alone, this development is certainly a warning sign as the model has produced some pretty good early warning signals for meaningful corrections in the past. But without any further red on the board, I think we need to continue to give the bulls the benefit of doubt.
The Fundamental Backdrop
Next, we review the market's fundamental factors including interest rates, the economy, earnings, inflation, and valuations.
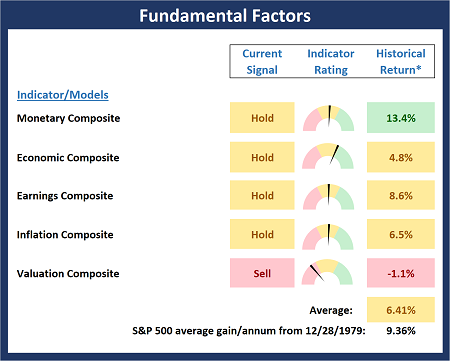
* Source: Ned Davis Research (NDR) as of the date of publication. Historical returns are hypothetical average annual performances calculated by NDR.
Current Take: Fundamental Models
There is also a change to the Fundamental Board this week as the Monetary Composite slipped to neutral. This looks to be the result of this year's quick backup in rates. And with no green on Buy Signals on the board, we need to recognize that this is NOT a low-risk environment.
The State of the Trend
After reviewing the big-picture models and the fundamental backdrop, I like to look at the state of the current trend. This board of indicators is designed to tell us about the overall technical health of the market's trend.
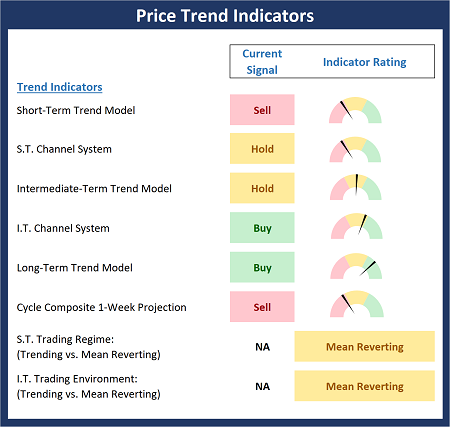
Current Take: Trend Models
The Trend Board continues to deteriorate with the ongoing pullback/correction in prices. At this stage, the intermediate-term trend remains "okay" but traders will be watching the near-term action very closely as any further weakness would represent more significant technical damage.
The State of Internal Momentum
Next, we analyze the momentum indicators/models to determine if there is any "oomph" behind the current move.
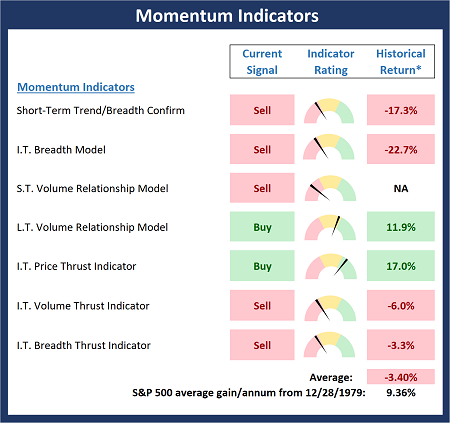
* Source: Ned Davis Research (NDR) as of the date of publication. Historical returns are hypothetical average annual performances calculated by NDR.
Current Take: Momentum Models
The Momentum Board remains worrisome and suggests that there is more damage to the market's technicals than meets the eye with the S&P 500. For me, this is the most concerning board of the bunch this week.
Early Warning Indicators
Finally, we look at our early warning indicators to gauge the potential for countertrend moves. This batch of indicators is designed to suggest when the table is set for the trend to "go the other way."
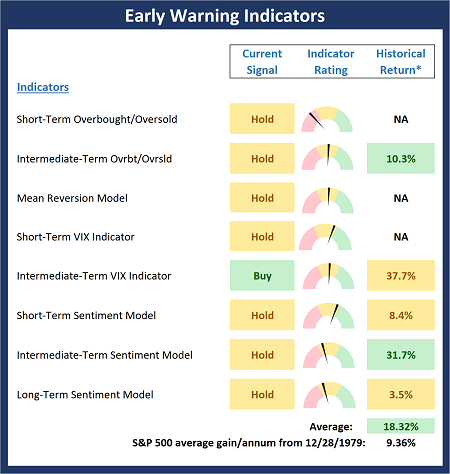
* Source: Ned Davis Research (NDR) as of the date of publication. Historical returns are hypothetical average annual performances calculated by NDR.
Current Take: Early Warning Models
Although stocks look to be a corrective mode so far in 2022, the Early Warning Board does not (yet) suggest that stocks are oversold enough to represent an opportunity to "go the other way." However, the action so far this morning should help the situation.
Thought for the Day:
Respect yourself and others will respect you. -Confucius
Wishing you green screens and all the best for a great day,

David D. Moenning
Founder, Chief Investment Officer
Heritage Capital Research, a Registered Investment Advisor

Disclosures
At the time of publication, Mr. Moenning held long positions in the following securities mentioned: None - Note that positions may change at any time.
NOT INDIVIDUAL INVESTMENT ADVICE. IMPORTANT FURTHER DISCLOSURES