Models Say Stay on Bull Bandwagon

Good Monday morning. As a reminder, I have decided to make a change to the presentation of our market models and my oftentimes meandering morning market missives.
The goal is to create a series of more concise, bite-sized reports, which will be published on a daily basis. Below is the weekly publishing schedule:
- Market Model Monday - A review of my key market models designed to indicate the state of the primary market cycle
- Technical Tuesday - An analysis of the current state of the market's trend and momentum
- Early Warning Wednesday - An examination the potential for counter-trend moves
- Thesis Thursday - My take on the key market drivers (or whatever else may be running through my mind)
- Fundamental Friday - A look of the state of the market's fundamental factors
It is my sincere hope that you find the new schedule easier to consume and more beneficial to your investing endeavors.
Since Mondays tend to be busy, I like to start the week with a quick review of the primary cycles (cyclical and secular) and my favorite big-picture market models. So let's get to it.
Primary Cycle Market Models
The key here is to start the week with a clear understanding of what type of market we are dealing with. Note that the primary cycles do not change often. As such, a quick glance at the color of the cycle board and the weekly/monthly S&P graphs below tells you everything you need to know about the "state" of the cycles.
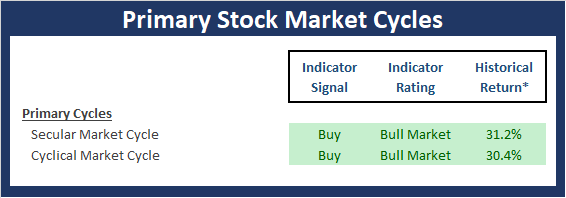
* Source: Ned Davis Research (NDR) as of the date of publication. Historical returns are hypothetical average annual performances calculated by NDR. Past performances do not guarantee future results or profitability - NOT INDIVIDUAL INVESTMENT ADVICE.
View the Primary Cycles Board Online
The Secular Market Cycle
A secular bull market is defined as a period in which stock prices rise at an above-average rate for an extended period (think 5 years or longer) and suffer only relatively short intervening declines. A secular bear market is an extended period of flat or declining stock prices. Secular bull or bear markets typically consist of multiple cyclical bull and bear markets. Below is a monthly chart of the S&P 500 Index illustrating the current cycle, which we estimate began on March 9, 2009.
S&P 500 - Monthly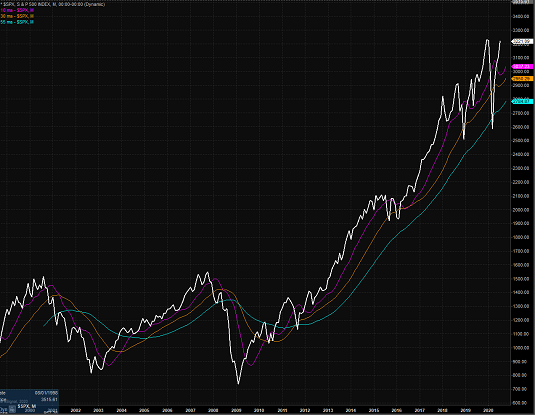
View Larger Chart
The Cyclical Market Cycle
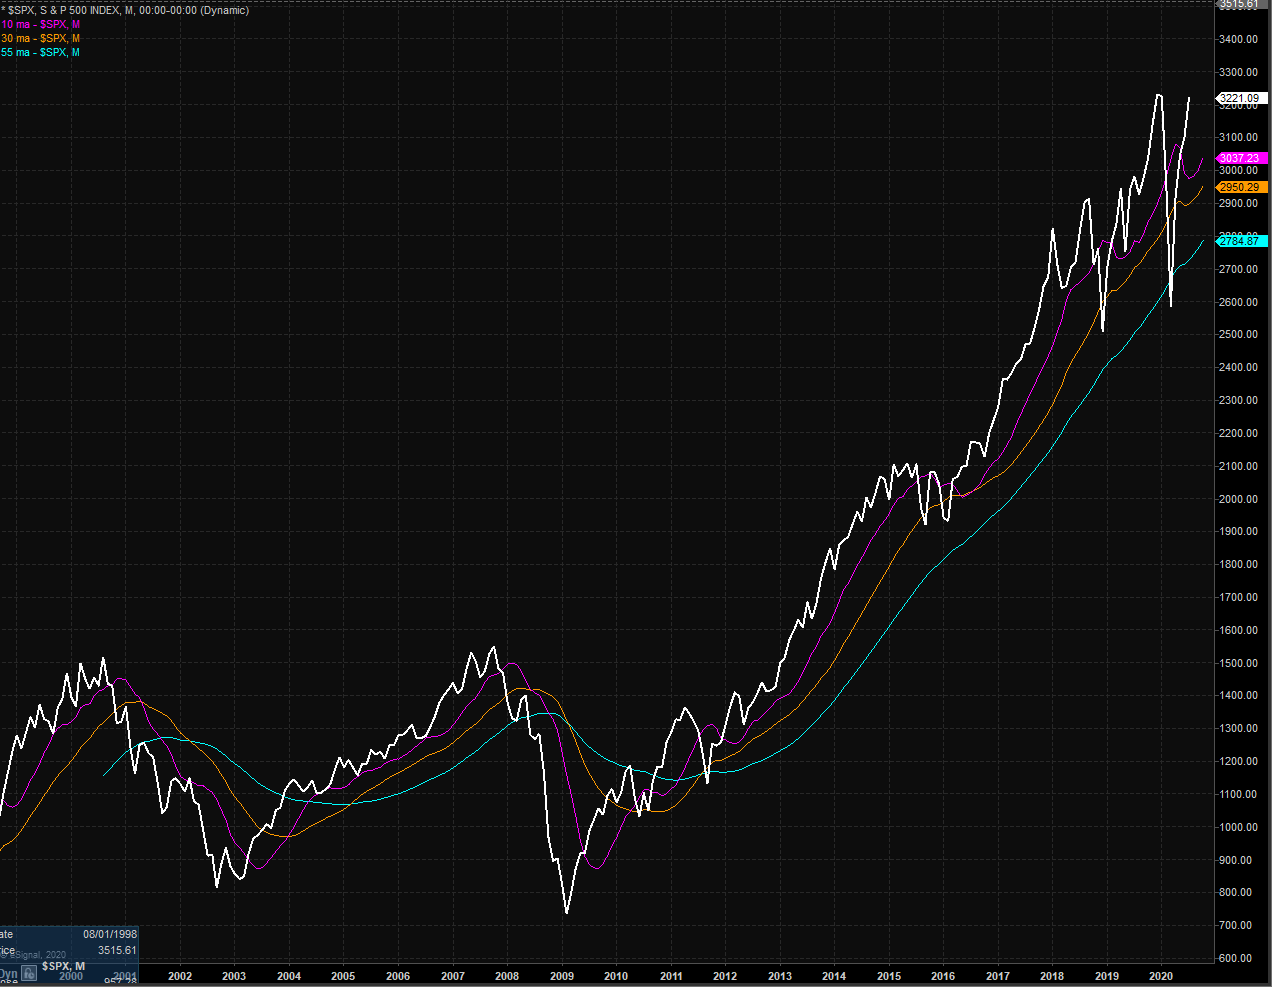
A cyclical bull market requires a 30% rise in the DJIA after 50 calendar days or a 13% rise after 155 calendar days. Reversals of 30% in the Value Line Geometric Index since 1965 also qualify. A cyclical bear market requires a 30% drop in the DJIA after 50 calendar days or a 13% decline after 145 calendar days. Reversals of 30% in the Value Line Geometric Index also qualify. Below is a weekly chart of the S&P 500 illustrating the current cycle, which we estimate began on March 24, 2020.
S&P 500 - Weekly
View Larger Chart
The Current State of the Primary Cycle Market Models
We have hand selected each model contained in this board. Note that I have utilized several of these models in our daily work for decades. Each of the models is designed to provide a standalone reading of market health and each has a strong historical record of staying on the proper side of the market's primary trend. Taken together, the Primary Cycle Model board is intended to help determine the overall "state of the market."
My Quick Take...
There are no changes to report on the Primary Cycle board once again this week. However, there are a couple nuances worth noting. First, our Leading Indicators model, which was teetering on the edge last week has upticked to a more neutral reading. In addition, our primary Intermediate-Term Market Model also saw some modest improvement. On the negative side of the ledger, our Fundamentals Factors Model lost a component to the dark side but remains solidly neutral overall. And with an hypothetical average return of the market given the current state of the models still well above the historical average, this tells me to continue to give the bulls the benefit of any/all doubt.

* Source: Ned Davis Research (NDR) as of the date of publication. Historical returns are hypothetical average annual performances calculated by NDR. Past performances do not guarantee future results or profitability - NOT INDIVIDUAL INVESTMENT ADVICE.
View the Primary Cycle Model Board Online
Thought For The Day:
It is amazing what you can accomplish if you do not care who gets the credit. --Harry Truman
Wishing you green screens and all the best for a great day,

David D. Moenning
Founder, Chief Investment Officer
Heritage Capital Research

Disclosures
At the time of publication, Mr. Moenning held long positions in the following securities mentioned: None - Note that positions may change at any time.
Primary Market Models Explained
Leading Indicators Model: A group of indicators that have historically shown tendencies to lead the market at major turning points.
Intermediate-Term Market Model: A composite model-of-models focused on trend and momentum indicators which has been designed to provide identify intermediate-term trading opportunities. The model includes 38 independent indicators covering price trends, volume, breadth, momentum, historical cycles, sentiment, and mean reversion.
Risk/Reward Model: A model-of-models designed to provide an overall view of the state of the risk/reward environment. The model includes tape, monetary, and sentiment indicators as well as 7 big-picture market model readings.
Desert Island Model: If I was stranded on a desert island with access to only one market model to manage money with, this would be the model. The model is a comprehensive model-of-models comprised of trend, momentum, mean reversion, economic, monetary, sentiment, and factor-based indicators/models.
Global Risk Model: A series of indicators designed to gauge the relative risk tolerance of the global investment environment.
Fundamental Factors Model: A model-of-models designed to provide a reading on the "macro state" of the environment. The model is comprised of indicators/models in the areas of monetary conditions, the economy, corporate earnings, inflation, and stock market valuation.
NOT INVESTMENT ADVICE. The opinions and forecasts expressed herein are those of Mr. David Moenning and Heritage Capital Research and may not actually come to pass. The opinions and viewpoints regarding the future of the markets should not be construed as recommendations. The analysis and information in this report is for informational purposes only. No part of the material presented in this report is intended as an investment recommendation or investment advice. Neither the information nor any opinion expressed constitutes a solicitation to purchase or sell securities or any investment program.
Any investment decisions must in all cases be made by the reader or by his or her investment adviser. Do NOT ever purchase any security without doing sufficient research. There is no guarantee that the investment objectives outlined will actually come to pass. All opinions expressed herein are subject to change without notice. Neither the editor, employees, nor any of their affiliates shall have any liability for any loss sustained by anyone who has relied on the information provided.
Mr. Moenning of Heritage Capital Research is an investment adviser representative of Eastsound Capital Advisors, LLC, a registered investment advisor. The adviser may not transact business in states where it is not appropriately registered, excluded or exempted from registration. Individualized responses to persons that involve either the effecting of transaction in securities, or the rendering of personalized investment advice for compensation, will not be made without registration or exemption.
Mr. Moenning and Heritage Capital Research may at times have positions in the securities referred to and may make purchases or sales of these securities while publications are in circulation. Positions may change at any time.
The analysis provided is based on both technical and fundamental research and is provided "as is" without warranty of any kind, either expressed or implied. Although the information contained is derived from sources which are believed to be reliable, they cannot be guaranteed.
The author neither endorses nor warrants the content of this site, any embedded advertisement, or any linked resource. The author or his managed funds may hold either long or short positions in the referenced securities. Republication rights must be expressly granted by author in writing.
Investments in equities carry an inherent element of risk including the potential for significant loss of principal. Past performance is not an indication of future results.