More Art Than Science
Executive Summary:
As I have mentioned a time or two, "early warning" or mean reversion work tends to be more art than science. The main problem is that strong trends will reach an "extreme" overbought/sold reading and then stay there for some time. As such, it is important to identify if the current market is in what I call a trending mode. To be sure, the bulls trended higher from late June through the start of September. However, the rather violent pullback that ensued forced my regime indicators back to a "mean reverting" (or non-trending) mode. For shorter-term traders, this means that one should "look alive" and be ready to move once overbought/sold levels are reached again in the oscillators. Such was the case recently as an oversold buy signal was flashed. However, it appears that signal is now being reversed. From my seat, the bottom line is that some additional downside exploration looks to be on the menu, which will likely lead to a solid buying opportunity.
Now let's take a look at our Early Warning board for clues about the near-term action...
The State of the "Early Warning" Indicators
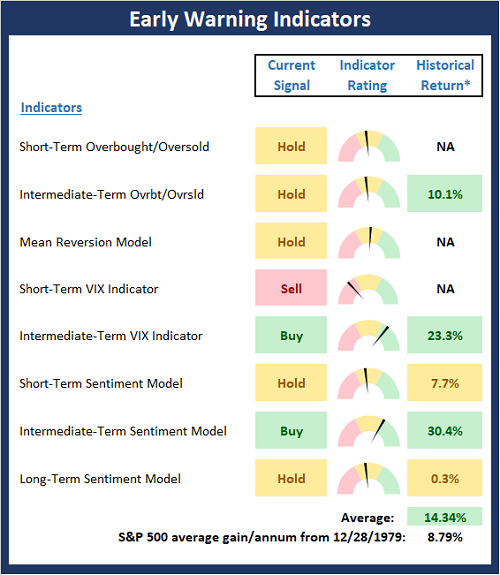
At first glance, there doesn't appear to be meaningful changes to Early Warning board this week. Sure, some of the indicators have traded places and there are now fewer buy and sell signals on the board. However, if you look closely you will find that the Intermediate-Term Sentiment Model upticked to a buy signal. This means that sentiment has reached negative levels and is now reversing. And when this occurs, the hypothetical annualized historical return of the S&P 500 has been a very strong +30.4%. In addition, the board's hypothetical annualized historical return has improved to + 14.3% from +5.3% last week. Therefore, I will opine that while there could easily be some additional downside in the near-term, the market looks to be in the process of setting up an entry point.
View Early Warning Indicator Board Online
* Source: Ned Davis Research (NDR) as of the date of publication. Historical returns are hypothetical average annual performances calculated by NDR. Past performances do not guarantee future results or profitability - NOT INDIVIDUAL INVESTMENT ADVICE.
Stochastic Review
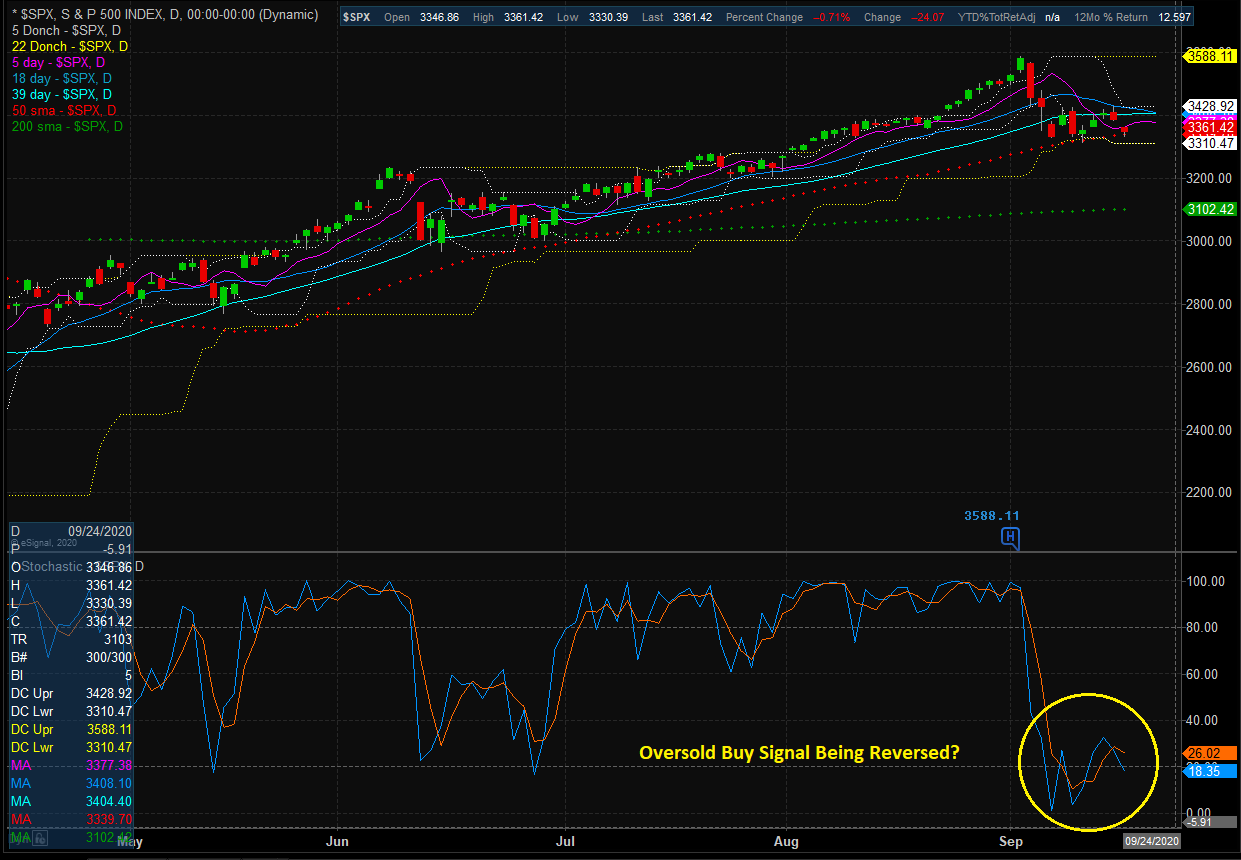
As I mentioned above, the buy signal on the stochastic indicator shown on the chart below recently flashed a buy signal. However, it appears that signal may be reversing. And if this is the case, then investors looking to buy stocks will be looking for the next setup. In short, I like to see the blue line move below both the red line and the 20% level, and then reverse. While not a perfect signal by any means, such an approach may tilt the odds in your favor if used consistently.
S&P 500 - Daily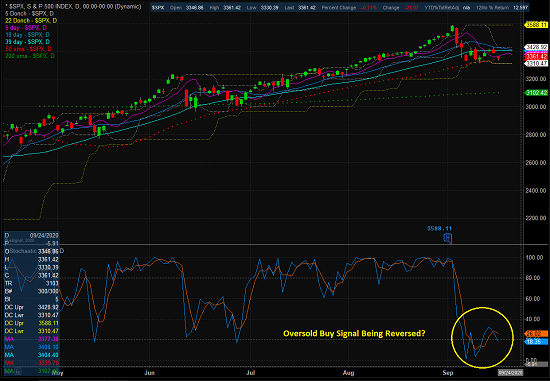
View Large Chart Online
Thought For The Day:
Kind words can be short and easy to speak, but their echoes are truly endless. -Mother Theresa
Wishing you green screens and all the best for a great day,

David D. Moenning
Founder, Chief Investment Officer
Heritage Capital Research

Disclosures
At the time of publication, Mr. Moenning held long positions in the following securities mentioned: None - Note that positions may change at any time.
Early Warning Models Explained
Short-Term Overbought/sold Indicator: This indicator is the current reading of the 14,1,3 stochastic oscillator. When the oscillator is above 80 and the %K is above the %D, the indicator gives an overbought reading. Conversely, when the oscillator is below 20 and %K is below its %D, the indicator is oversold.
Intermediate-Term Overbought/sold Indicator: This indicator is a 40-day RSI reading. When above 57.5, the indicator is considered overbought and when below 45 it is oversold.
Mean Reversion Model: This is a diffusion model consisting of five indicators that can produce buy and sell signals based on overbought/sold conditions.
VIX Indicator: This indicator looks at the current reading of the VIX relative to a series of Donchian Channel bands. When the indicator reaches an extreme reading in either direction, it is an indication that a market trend could reverse in the near-term.
Short-Term Sentiment Indicator: This is a model-of-models composed of 18 independent sentiment indicators designed to indicate when market sentiment has reached an extreme from a short-term perspective. Historical analysis indicates that the stock market's best gains come after an environment has become extremely negative from a sentiment standpoint. Conversely, when sentiment becomes extremely positive, market returns have been subpar.
Intermediate-Term Sentiment Indicator: This is a model-of-models composed of 7 independent sentiment indicators designed to indicate when market sentiment has reached an extreme from a intermediate-term perspective. Historical analysis indicates that the stock market's best gains come after an environment has become extremely negative from a sentiment standpoint. Conversely, when sentiment becomes extremely positive, market returns have been subpar.
Long-Term Sentiment Indicator: This is a model-of-models composed of 6 independent sentiment indicators designed to indicate when market sentiment has reached an extreme from a long-term perspective. Historical analysis indicates that the stock market's best gains come after an environment has become extremely negative from a sentiment standpoint. Conversely, when sentiment becomes extremely positive, market returns have been subpar.
NOT INVESTMENT ADVICE. The opinions and forecasts expressed herein are those of Mr. David Moenning and Heritage Capital Research and may not actually come to pass. The opinions and viewpoints regarding the future of the markets should not be construed as recommendations. The analysis and information in this report is for informational purposes only. No part of the material presented in this report is intended as an investment recommendation or investment advice. Neither the information nor any opinion expressed constitutes a solicitation to purchase or sell securities or any investment program.
Any investment decisions must in all cases be made by the reader or by his or her investment adviser. Do NOT ever purchase any security without doing sufficient research. There is no guarantee that the investment objectives outlined will actually come to pass. All opinions expressed herein are subject to change without notice. Neither the editor, employees, nor any of their affiliates shall have any liability for any loss sustained by anyone who has relied on the information provided.
Mr. Moenning of Heritage Capital Research is an investment adviser representative of Eastsound Capital Advisors, LLC, a registered investment advisor. The adviser may not transact business in states where it is not appropriately registered, excluded or exempted from registration. Individualized responses to persons that involve either the effecting of transaction in securities, or the rendering of personalized investment advice for compensation, will not be made without registration or exemption.
Mr. Moenning and Heritage Capital Research may at times have positions in the securities referred to and may make purchases or sales of these securities while publications are in circulation. Positions may change at any time.
The analysis provided is based on both technical and fundamental research and is provided "as is" without warranty of any kind, either expressed or implied. Although the information contained is derived from sources which are believed to be reliable, they cannot be guaranteed.
The author neither endorses nor warrants the content of this site, any embedded advertisement, or any linked resource. The author or his managed funds may hold either long or short positions in the referenced securities. Republication rights must be expressly granted by author in writing.
Investments in equities carry an inherent element of risk including the potential for significant loss of principal. Past performance is not an indication of future results.