My Base Case
Executive Summary:
One week ago, investors fretted about keeping up as the stock market winners continued to march higher on a daily basis. But as the saying goes, trees don't grow to the sky and our Early Warning board gave us ample time to recognize that the "table had been set" for some countertrend action.
I wrote last week, "My guess is that when the bears do finally find a raison d'etre (and they will, it's only a matter of time), we should expect the selling to be intense for a few days." I also opined that since we had a "good overbought" condition going, a catalyst would likely be needed for the bears to get up off the mat. Normally, a headline, a tweet, or a shift in policy would be the trigger for the bears to get a selling party started. This time it was strange action in options and volatility that appeared to be the catalyst for the fastest move from an all-time high to "correction territory" on the NASDAQ Composite in history.
After a quick dance to the downside, which took the NASDAQ 100 down -10.9% and the S&P 500 nearly -7% in three days, stocks quickly reached oversold territory. As is usually the case, a bounce then ensued. Which brings us to today and the question of, where do we go from here?
My base case is we are seeing a correction within an ongoing cyclical bull market. We'll be watching the intermediate-term momentum indicators closely in the coming days/weeks as our key "tell" on the subject. In short, if the intermediate-term breadth indicators hold up (so far, so good), we can assume the bulls will regain control at some point soon. But if not, then some additional downside exploration can be expected.
Now let's take a look at our Early Warning board for clues about the near-term action...
The State of the "Early Warning" Indicators
The Early Warning board has clearly shifted this week. And while there is no "table pounding" message at this point in time, the bulls appear to have a slight edge on the board here. However, I would expect the bears to put up a fight in the near-term in order to "test" the bulls' resolve going forward. And while the dip buyers could always run the indices right back to the highs, I'd prefer to see some further consolidation to further dampen the speculative froth that had developed. And since this pullback appears to have been driven by technicals, my best guess is the bulls will return to form in the next week or so.
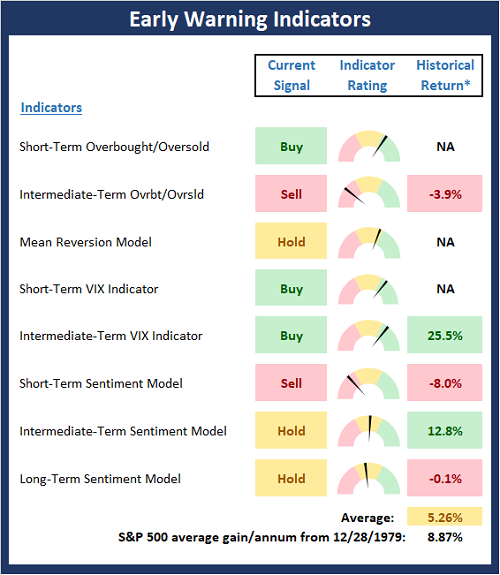
View Early Warning Indicator Board Online
* Source: Ned Davis Research (NDR) as of the date of publication. Historical returns are hypothetical average annual performances calculated by NDR. Past performances do not guarantee future results or profitability - NOT INDIVIDUAL INVESTMENT ADVICE.
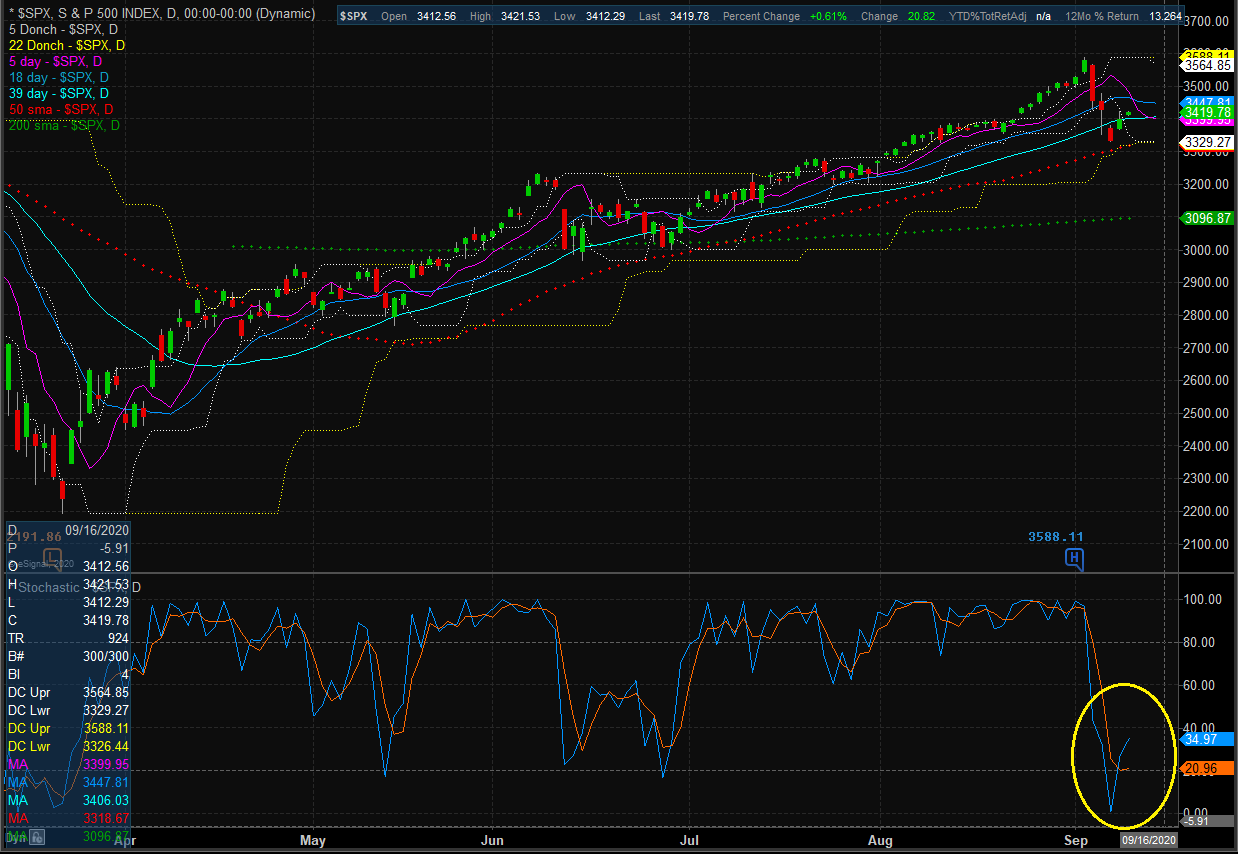
Stochastic Review
Last week, with the market overbought and investors clearly having become complacent, I wrote, "If the market follows the script, we can expect a scary decline in response to whatever fear comes out of the woodwork next. These bouts of selling tend to be short and sharp, and in my experience, represent a good time to put additional funds to work."
Sure enough, the ensuing decline unfolded as expected. The quick trip down pushed the stochastics into oversold territory and yesterday's reversal has triggered a short-term buy signal. The key from here will be whether or not the bears have any staying power and can produce a more prolonged oversold condition - which would be preferred from an intermediate-term perspective.
S&P 500 - Daily
View Large Chart Online
Thought For The Day:
Not getting what you want is sometimes a wonderful stroke of luck. - Dalai Lama
Wishing you green screens and all the best for a great day,

David D. Moenning
Founder, Chief Investment Officer
Heritage Capital Research

Disclosures
At the time of publication, Mr. Moenning held long positions in the following securities mentioned: None - Note that positions may change at any time.
Early Warning Models Explained
Short-Term Overbought/sold Indicator: This indicator is the current reading of the 14,1,3 stochastic oscillator. When the oscillator is above 80 and the %K is above the %D, the indicator gives an overbought reading. Conversely, when the oscillator is below 20 and %K is below its %D, the indicator is oversold.
Intermediate-Term Overbought/sold Indicator: This indicator is a 40-day RSI reading. When above 57.5, the indicator is considered overbought and when below 45 it is oversold.
Mean Reversion Model: This is a diffusion model consisting of five indicators that can produce buy and sell signals based on overbought/sold conditions.
VIX Indicator: This indicator looks at the current reading of the VIX relative to a series of Donchian Channel bands. When the indicator reaches an extreme reading in either direction, it is an indication that a market trend could reverse in the near-term.
Short-Term Sentiment Indicator: This is a model-of-models composed of 18 independent sentiment indicators designed to indicate when market sentiment has reached an extreme from a short-term perspective. Historical analysis indicates that the stock market's best gains come after an environment has become extremely negative from a sentiment standpoint. Conversely, when sentiment becomes extremely positive, market returns have been subpar.
Intermediate-Term Sentiment Indicator: This is a model-of-models composed of 7 independent sentiment indicators designed to indicate when market sentiment has reached an extreme from a intermediate-term perspective. Historical analysis indicates that the stock market's best gains come after an environment has become extremely negative from a sentiment standpoint. Conversely, when sentiment becomes extremely positive, market returns have been subpar.
Long-Term Sentiment Indicator: This is a model-of-models composed of 6 independent sentiment indicators designed to indicate when market sentiment has reached an extreme from a long-term perspective. Historical analysis indicates that the stock market's best gains come after an environment has become extremely negative from a sentiment standpoint. Conversely, when sentiment becomes extremely positive, market returns have been subpar.
NOT INVESTMENT ADVICE. The opinions and forecasts expressed herein are those of Mr. David Moenning and Heritage Capital Research and may not actually come to pass. The opinions and viewpoints regarding the future of the markets should not be construed as recommendations. The analysis and information in this report is for informational purposes only. No part of the material presented in this report is intended as an investment recommendation or investment advice. Neither the information nor any opinion expressed constitutes a solicitation to purchase or sell securities or any investment program.
Any investment decisions must in all cases be made by the reader or by his or her investment adviser. Do NOT ever purchase any security without doing sufficient research. There is no guarantee that the investment objectives outlined will actually come to pass. All opinions expressed herein are subject to change without notice. Neither the editor, employees, nor any of their affiliates shall have any liability for any loss sustained by anyone who has relied on the information provided.
Mr. Moenning of Heritage Capital Research is an investment adviser representative of Eastsound Capital Advisors, LLC, a registered investment advisor. The adviser may not transact business in states where it is not appropriately registered, excluded or exempted from registration. Individualized responses to persons that involve either the effecting of transaction in securities, or the rendering of personalized investment advice for compensation, will not be made without registration or exemption.
Mr. Moenning and Heritage Capital Research may at times have positions in the securities referred to and may make purchases or sales of these securities while publications are in circulation. Positions may change at any time.
The analysis provided is based on both technical and fundamental research and is provided "as is" without warranty of any kind, either expressed or implied. Although the information contained is derived from sources which are believed to be reliable, they cannot be guaranteed.
The author neither endorses nor warrants the content of this site, any embedded advertisement, or any linked resource. The author or his managed funds may hold either long or short positions in the referenced securities. Republication rights must be expressly granted by author in writing.
Investments in equities carry an inherent element of risk including the potential for significant loss of principal. Past performance is not an indication of future results.