New Bull Market? Or...

The question of the day is if the recent rebound in stocks represents the beginning of a new bull market - or - a run-of-the-mill bear market rally, which tend to occur from time to time during extended bearish cycles.
To be sure, there are plenty of talking heads for each team to latch onto here. For example, last week the venerable Art Cashin told the CNBC audience that he believes this to be a bear market rally and that stocks will ultimately retest the June lows. Next, we learned recently that Michael Burry, of The Big Short fame, has been selling his stocks and warning of economic pain down the road. Then there is Morgan Stanley's Mike Wilson, perhaps the biggest, baddest bear of them all, who suggests that investors shouldn't be fooled by the recent run higher. And finally, BofA's Michael Hartnett reminded us that the current advance looks like a "textbook" bear rally.
And yes, on the other side, there are plenty of folks who have publicly planted the new bull market flag. With great bravado, each tells us why they believe the bear is over and that it's time to jump into stocks with both feet.
But the questions remain. Is the rally for real? Is there significant upside ahead? Is it time to buy? Or will the recent joyride to the upside fizzle out as the negative macro issues that created the bear in the first-place return?
While I hate to disappoint, decades of experience in Ms. Market's game have taught me that it is nearly impossible to know the answer. No, the only REAL way to know how the recent rally should be labeled is with a healthy dose of hindsight.
In reality, the best anyone can do in these situations is to (a) look at both sides of the argument, (b) develop a plan based on your outlook, and (c) remain flexible and open-minded.
So, let's take a look at the question at hand and see if we can't get a handle on what is happening here...
Quick Take: Technicals Favor Bulls, Macro Favors Bears
Let's start with the bull case. I.E. That the 17.2% rebound from the June 22 low represents the beginning of a new bull market. And since the average bull market from 1900 has experienced gains of between +85% and +100% (according to Ned Davis Research Group, the mean return for cyclical bull markets occurring within a secular bull cycle has been 105.3% over 751 days while the mean for all bull markets since 1900 has been 85.9% over 576 trading days) there are certainly good reasons to be excited about the stock market.
The primary arguments for the new bull market case are technical in nature. In short, the recent price action has been very constructive. For example, several "breadth thrust" buy signals have occurred, the major indices have put in "higher highs" both on a short- and intermediate-term basis (the basic component of an uptrend), the rally has been broad-based with small- and mid-caps participating, and history shows once the S&P 500 recovers 50% of a bear market's decline, the indices have never broken to new lows.
Trust the Thrust
Long-time readers of my oftentimes meandering market missive know that I'm a big fan of breadth thrust signals. In short, these are momentum indicators designed to tell us when either buying or selling has become overwhelmingly one-sided over a short-term period. The original Breadth Thrust indicator, which measured the average of advances versus declines over a 10-day period, was developed by the late Marty Zweig. And as Ned Davis is famous for saying, it pays to "trust the thrust." For good reason. History shows that when a breadth thrust signal occurs, it tends to be an "all clear" signal for the next year.
We maintain a Breadth Thrust Model, which is comprised of five separate breadth thrust indicators. The model itself is pretty simple to use, when the majority of thrust indicators flash buy signals, the model itself gives a signal.
I personally put a lot of faith in this approach due to reliability of the signals. Looking at each component indicator's signals from a hypothetical standpoint, history shows that one month after a buy signal is given, the S&P 500 has been higher 74% of the time. Three months later, the market has been higher 77.1% of the time. Six months after: 86.1%. And one year out, the market has been higher 97.2% of the time.
Another way to look at the hypothetical history here is that of the 144 signals the five component indicators in my model have flashed, only 4 have been losers one year after the signal was given. Not bad, eh?
So, cutting to the chase, when my Breadth Thrust model flashes a buy, as it did on July 28th, I take notice. Sure, I'd like to see all 5 models flash buys, as there are two that haven't yet. And yes, I'd like confirmation from other indicators/models. But the fact that the majority of the Breadth Thrust signals say "go," is a good reason to look on the bright side for the coming 3,6, and 12 months.
The Trend is Your Friend
It's also positive that the major indices are now in an uptrend. By definition, an uptrend occurs when the market makes a series of higher highs and higher lows. And once the S&P moved above the June 3rd closing high, a "higher high" and, in turn, an uptrend was in place. 'Nuf said.
Fibonacci Retracement History is Encouraging
Then there is the history of what happens after the market "retraces" at least 50% of the bear market decline. According to BTIG's Chief Market Technician, Jonathan Krinsky, the key level here was S&P 4231. At this point, the venerable blue-chip index recovered more than half of the bear market loss. This is important because, according to Krinsky, since 1950 the market has NEVER made a new low after a 25% decline was followed by a 50% retracement.
Granted, history shows there were three healthy drawdowns during the period studied after the S&P recovered half the loss - 1974, 2014, and December 2009. But the key is that the market never made a new low. As such, Krinsky (and others) use this to opine that the low for this bear market is in.
Three "Peak" Narratives
In addition to the positive technical action, our heroes in horns point to several "peak" narratives as reasons to hop on the bull train here. First, there is the "peak inflation" theme, which argues that inflation has peaked and will begin to trend lower in the months ahead.
Our indicators and models on inflation back up this concept as many components of inflation are indeed declining. And our Inflation model has slipped into the neutral zone (albeit by the skinniest of margins) which means that inflation pressures should decline in the coming quarter. I will note that this model did a fine job of warning us of increasing inflationary pressures - back in the fall of 2020, which was well BEFORE inflation became a problem.
Next is the "peak Fed hawkishness" theme. If inflation can begin to trend lower, the thinking is that the Fed will be able to take its foot off the gas at some point in the future. I.E. We've seen the worst from Jay Powell's merry band of central bankers. And since markets look AHEAD by 6-9 months, it makes sense that a less antagonistic Fed could be a positive.
And finally, there is the "peak volatility" theme - as in, we've seen the worst of the market's nasty volatility. Analysts point to the downward trend in the VIX as Exhibit A here. Of course, time - and a great deal of hindsight - will tell if the trend will continue and if volatility can remain muted. But, if inflation can begin to recede and the economy remains no worse for wear, then it follows that the worst of the violent down days may be behind us.
But...
The first caveat that must be provided after the bull case is that stocks have run a long way in a short period of time. Thus, the market has become overbought from both a short- and intermediate-term time frame. So, with sentiment having become rather upbeat lately and important technical resistance overhead, a pause - at a minimum - is to be expected.
Exhibit A here is the market action seen since the S&P bumped its head on its 200-day moving average on Tuesday afternoon. Not surprisingly, sell programs were waiting and the market has been pulling back ever since. And given the setup, we wouldn't at all be surprised to see the bears get back in the game in order to restore some equilibrium.
The Bear Market Rally Case
Now it's time to look at the argument from our furry friends in the bear camp, who contend that the impressive bounce from the June low will turn out to be a typical bear market rally. I.E. A rally that occurs within the context of an ongoing bear cycle, with new lows to come.
From our seat, the big question is if inflation can decline "enough" within the market's forward-looking time window. Yes, things like oil, gasoline, and other commodities have pulled back, which will cause inflation to fall enough for many to call the peak in the inflation surge. And with supply chain issues continuing to improve, the components of inflation that were viewed as "transitory," will likely wind up being just that.
However, there are other components of inflation that are NOT moving down to any great degree - things like wages and "shelter" (rent and owner's equivalent rents). The concern is that a good "chunk" of inflation will prove to be quite sticky. So sticky that Powell & Co will be forced to continue to "fight inflation" aggressively, which means more rate hikes than the markets are currently expecting.
Or, as the uber-Bears contend, another fear is the peak in inflation may not have occurred yet. This group points to the new highs in inflation seen in the UK and Europe last week. So, if you want to really fret about the market outlook, consider the idea of even higher inflation (not a likely occurrence at all, IMO) from here.
Next up is the issue of the "Fed pivot" - a point in time where the Fed will change their tune and stop raising rates (or at the very least, stop raising rates so aggressively). To be sure, the Fed is "not even thinking about thinking about" cutting rates at this time. No, the entire FOMC has made it abundantly clear that fighting inflation is Job 1 at this time.
The concern here is since there is a significant lag between the time rate hikes occur and the ensuing impact on the economy and/or consumer behavior, the Fed may not get the timing quite right. So, as the Fed attempts to bring the overheated economy and inflation back down to earth, the fear is the "landing" may involve fire trucks, ambulances, and a host of emergency vehicles.
In other words, those seeing the glass as at least half empty contend that the Fed will wind up going too far, wrecking the economy in the process. And given the rather significant deterioration seen in many economic reports of late, it is tough to simply brush aside this worry.
Of course, if the economy suffers from the Fed going too far, it follows that earnings will be hurt as well. And far more than the recent action had "priced in."
Next up is the history of bear market rallies. BofA's Michael Hartnett did a study of rallies of 10% or more during what the bank views as "official" bear market periods. Mr. Hartnett found that the average gain of bear market rallies was 17.2% over 39 days. He then pointed out that the current rally has produced a gain of... wait for it... 17.2% over 41 days. As such, BofA contends that the recent run for the roses was a run-of-the-mill or "textbook" bear market rally, that ought to soon give way to more downside.
So, there you have it. Some pretty good reasons to believe that we've seen the worst and that a new bull market has begun - and a few arguments for the idea that there is more pain ahead.
Please understand that you don't have to pick a side. No, our take is that this is going to take a while. And that a series of fits and starts (rallies and pullbacks) is the most likely result in the coming months as traders try and determine the most appropriate outlook for the coming 2-3 quarters.
From our seat, the best plan for this environment is to (a) retain as much flexibility as possible for your investing strategy, (b) keep an open mind and avoid "planting the flag" with your opinion on the outcome, and (c) commit to being as nimble as possible when/if conditions change.
Remember, this game isn't about "being right," it's about "getting it right." And during times like these "getting it right" may involve being patient (as in VERY patient) as well as maintaining the flexibility to make adjustments if you wind up being wrong.
Now let's review the "state of the market" through the lens of our market models...
The Big-Picture Market Models
We start with six of our favorite long-term market models. These models are designed to help determine the "state" of the overall market.
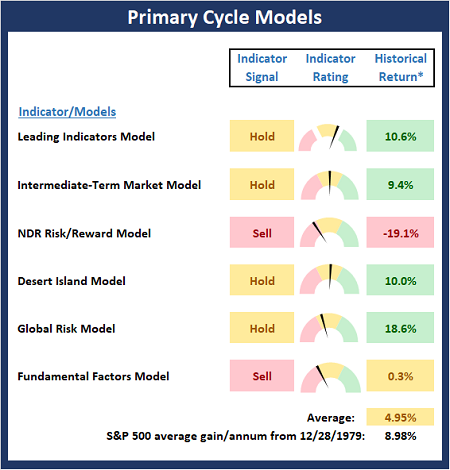
* Source: Ned Davis Research (NDR) as of the date of publication. Historical returns are hypothetical average annual performances calculated by NDR.
The Fundamental Backdrop
Next, we review the market's fundamental factors including interest rates, the economy, earnings, inflation, and valuations.
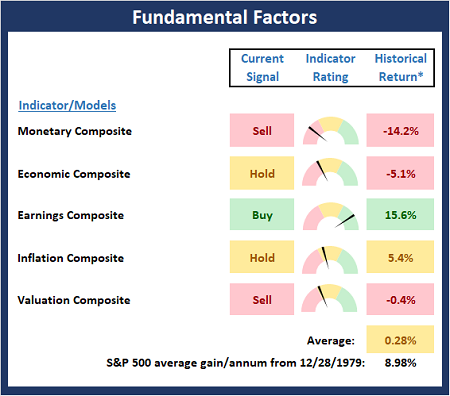
* Source: Ned Davis Research (NDR) as of the date of publication. Historical returns are hypothetical average annual performances calculated by NDR.
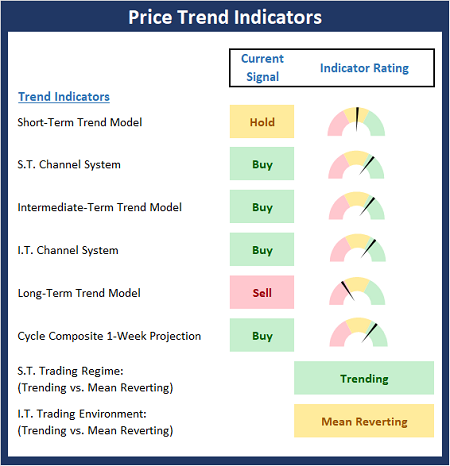
The State of the Trend
After reviewing the big-picture models and the fundamental backdrop, I like to look at the state of the current trend. This board of indicators is designed to tell us about the overall technical health of the market's trend.
The State of Internal Momentum
Next, we analyze the momentum indicators/models to determine if there is any "oomph" behind the current move.
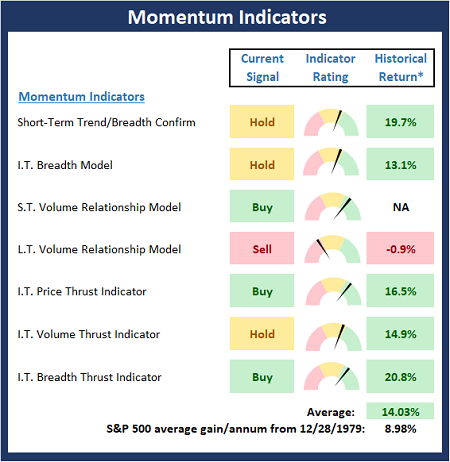
* Source: Ned Davis Research (NDR) as of the date of publication. Historical returns are hypothetical average annual performances calculated by NDR.
Early Warning Indicators
Finally, we look at our early warning indicators to gauge the potential for countertrend moves. This batch of indicators is designed to suggest when the table is set for the trend to "go the other way."
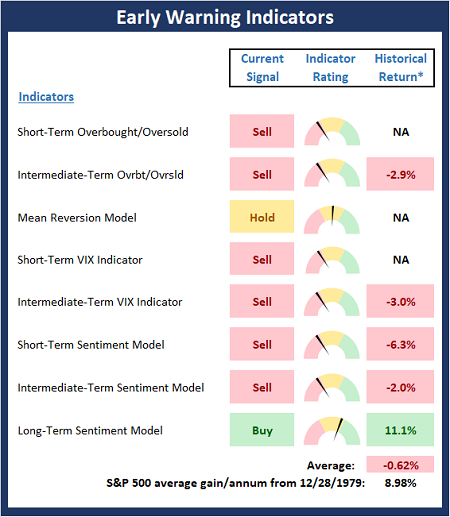
* Source: Ned Davis Research (NDR) as of the date of publication. Historical returns are hypothetical average annual performances calculated by NDR.
Thought for the Day:
Courage is knowing what not to fear. -Plato
Wishing you green screens and all the best for a great day,

David D. Moenning
Founder, Chief Investment Officer
Heritage Capital Research, a Registered Investment Advisor

Disclosures
At the time of publication, Mr. Moenning held long positions in the following securities mentioned: None - Note that positions may change at any time.
NOT INDIVIDUAL INVESTMENT ADVICE. IMPORTANT FURTHER DISCLOSURES