No Pivot For You!
Given Friday's violent move in the stock market, I think it is a good idea to take a step back and review where we've been of late. The idea is to try and understand why the market has done what it has done, in the hopes that we can better know what to possibly expect going forward. So, let's start the new week by looking at the drivers of the market's most recent moves including the June lows and the ensuing rebound.
For starters, and while this is clearly just one man's opinion, I believe the rally in the stock market from the June lows represented a "correction of the correction." I.E. A countertrend move to "challenge" the overriding narrative in place at the time.
My thinking is that the S&P 500's decline of nearly 24% into June 22nd represented the overdone worries about the economy falling into recession. With nominal GDP coming in above 7% and the labor market remaining exceptionally strong (if memory serves, there are still twice as many job openings are there are workers to fill them), it was just a little silly to think that the economy was either already in or about to enter a recession.
So, with stocks oversold from just about every measure imaginable and valuations having fallen into a more reasonable zone, it wasn't surprising to see the bulls get up off the mat and for a rebound to occur. Besides the oversold conditions, the narrative behind what became a 17.2% joyride to the upside was that the economy and earnings were doing just fine, thank you, and that the Fed was likely to take its foot off the brake pedal at some point in the not-too distant future.
This idea certainly made some sense. The Fed had already hiked rates 225 basis points (bps) and there was another 50-75 bps on the way in September. Now toss in a couple more 50 bps hikes before year end, and it appeared that the Fed Funds rate would end the year in the 3.5% to 4.0% zone. And to many analysts, this represented a good area for the Fed to "take a break and look around" for a while.
In essence, this was the beginning of what wound up being the "Fed Pivot" narrative. The idea that the Fed would be able to stop hiking rates so aggressively within the time frame the stock market tends to look ahead to (6-9 months). As such, the worst was over, and it was time to look ahead to better days.
To be sure, very few analysts truly expected the Fed to CUT rates any time soon. No, the looking ahead to brighter days was tied to the idea that the Fed would be able to bring inflation down without wrecking the economy in the process. And that soon enough (6-9 months from now), the potential for pain would be over.
However, somehow, some way, the concept of looking ahead to brighter days turned into an expectation that the Fed would actually start cutting rates in Q2 of 2022. From my point of view, this idea was always well off the mark. After all, the country is experiencing an inflation surge the likes of which hasn't been seen in 40 years. And while inflation HAS indeed pulled back a bit, neither the CPI nor the Fed's preferred measure of inflation - Core PCE - are anywhere near the 2% target zone. No, 6% - 8.5% readings are still a country mile from the objective.
And this is basically what Jay Powell told us on Friday during his unusually brief and to the point speech from Jackson Hole, Wyoming.
Powell began by saying, "My remarks will be shorter, my focus narrower, and my message more direct." In other words, pay attention folks, I'm only going to say this once - and I'm not going to mince words.
In my humble opinion, the Fed Chair didn't say anything new in his speech. First, he reiterated that the FOMC was committed to bringing inflation down. Duh.
Next, he reminded us that his group would "use our tools forcefully" to attack inflation that is still running near its highest level in more than 40 years. Got it.
Then he said that "fighting inflation will cause some pain to households and businesses," which is "the unfortunate costs of reducing inflation." Ok. So, a recession is possible. I'm pretty sure everybody knew that by now.
Next, Powell reminded us that, "restoring price stability will likely require maintaining a restrictive policy stance for some time." From my seat, THIS is where the markets started to sit up and take notice.
Powell then turned to history, saying the inflation of 40 years ago provides the current Fed with three lessons: That central banks are responsible for managing inflation, that expectations are critical and that, "we must keep at it until the job is done."
But here's the part that markets may not have been prepared for and may have represented a "wait, what?" moment. Powell said bluntly, "The historical record cautions strongly against prematurely loosening policy." (So much for that rate cut in early 2023!)
He went on to say that the Fed's goal is to avoid the "stop-start" approach taken in the 1970's and early 1980's, which resulted in prolonged economic pain - so as to "avoid that outcome by acting with resolve now."
All in, Chair Powell packed a lot into his 8-minute speech. Here are the takeaways: The Fed is committed to fighting inflation. They aren't going to stop until the job is done. They aren't going to implement a "stop and look around" approach. The economy is strong and can likely handle the fight. As a result, we should expect rates to be higher for longer.
From my perch, the market overreacted on Friday - but then again, once the algos get on a roll, that's just the way the game is played these days. For those fast money traders out there, Powell's speech made it clear that there is no end in sight to the rate hike campaign. It was as if Jay Powell was channeling his inner "Soup Nazi," telling traders, "No pivot for you!"
And while I do believe it was folly to think that the Fed was even close to "thinking about thinking about" cutting rates, pushing the green pastures of rate cuts out beyond the horizon clearly wasn't well received.
So, where do we go from here? Frankly, after Friday's hysterics, the answer is anybody's guess. Perhaps some further "price discovery" to the downside is required now as traders try and come to grips with the "not-so new normal." As I have been saying for some time now, I expect the "bottoming process" to take some time and that some "back and forth" action is to be expected.
However, as I've also opined a time or two lately, this is the type of environment that requires both patience and flexibility. So, as we start the new week, a week that begins one of the calendar's weakest months, as well as another Jobs Report, it will be important to keep one's eyes, ears, and mind open. Stay tuned, this is sure to be interesting!
Now let's review the "state of the market" through the lens of our market models...
The Big-Picture Market Models
We start with six of our favorite long-term market models. These models are designed to help determine the "state" of the overall market.
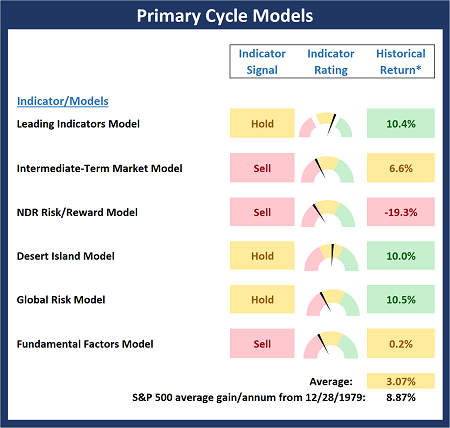
* Source: Ned Davis Research (NDR) as of the date of publication. Historical returns are hypothetical average annual performances calculated by NDR.
The Fundamental Backdrop
Next, we review the market's fundamental factors including interest rates, the economy, earnings, inflation, and valuations.
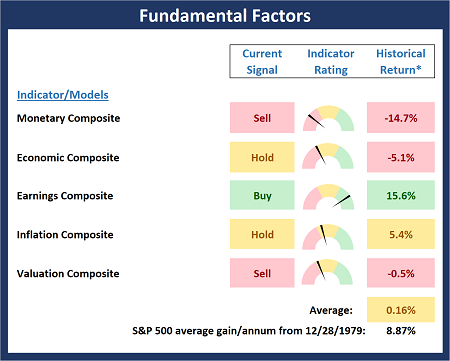
* Source: Ned Davis Research (NDR) as of the date of publication. Historical returns are hypothetical average annual performances calculated by NDR.
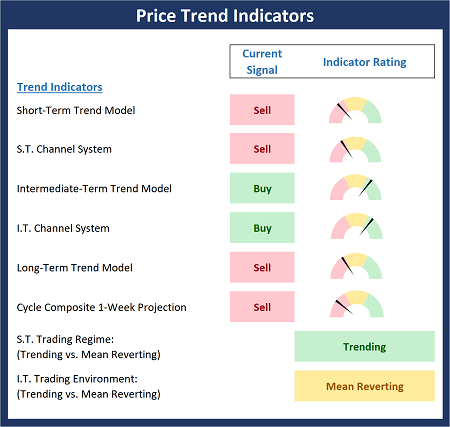
The State of the Trend
After reviewing the big-picture models and the fundamental backdrop, I like to look at the state of the current trend. This board of indicators is designed to tell us about the overall technical health of the market's trend.
The State of Internal Momentum
Next, we analyze the momentum indicators/models to determine if there is any "oomph" behind the current move.
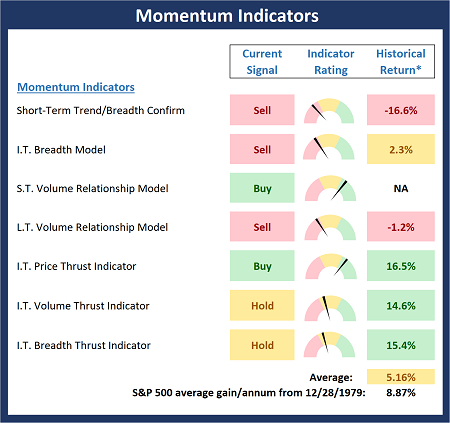
* Source: Ned Davis Research (NDR) as of the date of publication. Historical returns are hypothetical average annual performances calculated by NDR.
Early Warning Indicators
Finally, we look at our early warning indicators to gauge the potential for countertrend moves. This batch of indicators is designed to suggest when the table is set for the trend to "go the other way."
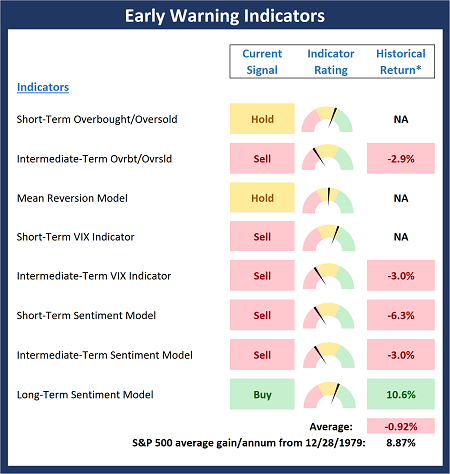
* Source: Ned Davis Research (NDR) as of the date of publication. Historical returns are hypothetical average annual performances calculated by NDR.
Thought for the Day:
Wise men talk because they have something to say; fools, because they have to say something. --Plato
Wishing you green screens and all the best for a great day,

David D. Moenning
Founder, Chief Investment Officer
Heritage Capital Research, a Registered Investment Advisor

Disclosures
At the time of publication, Mr. Moenning held long positions in the following securities mentioned: None - Note that positions may change at any time.
NOT INDIVIDUAL INVESTMENT ADVICE. IMPORTANT FURTHER DISCLOSURES