Of #FOMO and #OnHold
Executive Summary:
Stocks remain overbought, sentiment remains at extreme levels, and IMO, complacency has set in. And yet, the S&P 500 and NASDAQ indices continue to march higher on a daily basis. As such, the bears are sure to be asking, how can this be? From my seat, the answer is simple. As we've been discussing for many weeks now, stocks appear to be enjoying a "good overbought" condition, where the market gets overbought and stays overbought - until the bears can find a meaningful catalyst to cause some real selling. Until then, it appears that FOMO and capitulation are driving the action. The bottom line is that by now, everybody on the planet knows they need to be in megacap tech and the COVID winners. And with everyone jumping on the same bandwagon, the trend continues. Until it doesn't, of course!
The State of the "Early Warning" Indicators
There are no changes to report on the Early Warning board this week. My take on the current state of the Early Warning Indicators is the "table" continues to be set for some countertrend action - or at the very least, a period of consolidation. My guess is that when the bears do finally find a raison d'etre (and they will, it's only a matter of time), we should expect the selling to be intense for a few days.
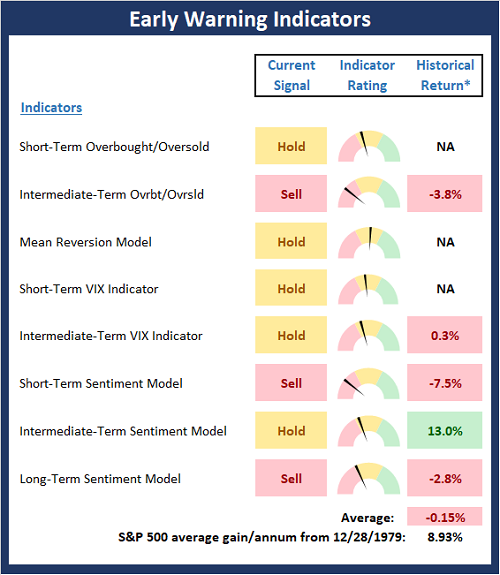
View Early Warning Indicator Board Online
* Source: Ned Davis Research (NDR) as of the date of publication. Historical returns are hypothetical average annual performances calculated by NDR. Past performances do not guarantee future results or profitability - NOT INDIVIDUAL INVESTMENT ADVICE.
Stochastic Review
The market continues to grind higher on a daily basis here and there has been little-to-no downside action since the end of June. And while I do believe we've got a "good overbought" condition on our hands, we have seen this movie before.
If the market follows the script, we can expect a scary decline in response to whatever fear comes out of the woodwork next. These bouts of selling tend to be short and sharp, and in my experience, represent a good time to put additional funds to work.
But for now, I'd be #OnHold with regard to new buying here.
S&P 500 - Daily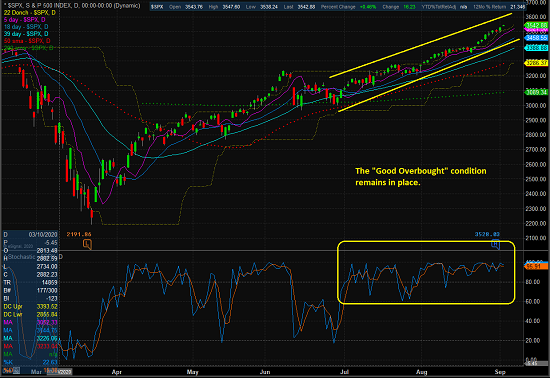
View Large Chart Online
Publishing Note: My schedule on Thursday mornings continues to be busy. Therefore until further notice, my "Thesis Thursday" reports will be published when possible/as needed.
Thought For The Day:
If there's only one answer, then this must not be a very interesting topic. - Ron Jeffries
Wishing you green screens and all the best for a great day,

David D. Moenning
Founder, Chief Investment Officer
Heritage Capital Research

Disclosures
At the time of publication, Mr. Moenning held long positions in the following securities mentioned: None - Note that positions may change at any time.
Early Warning Models Explained
Short-Term Overbought/sold Indicator: This indicator is the current reading of the 14,1,3 stochastic oscillator. When the oscillator is above 80 and the %K is above the %D, the indicator gives an overbought reading. Conversely, when the oscillator is below 20 and %K is below its %D, the indicator is oversold.
Intermediate-Term Overbought/sold Indicator: This indicator is a 40-day RSI reading. When above 57.5, the indicator is considered overbought and when below 45 it is oversold.
Mean Reversion Model: This is a diffusion model consisting of five indicators that can produce buy and sell signals based on overbought/sold conditions.
VIX Indicator: This indicator looks at the current reading of the VIX relative to a series of Donchian Channel bands. When the indicator reaches an extreme reading in either direction, it is an indication that a market trend could reverse in the near-term.
Short-Term Sentiment Indicator: This is a model-of-models composed of 18 independent sentiment indicators designed to indicate when market sentiment has reached an extreme from a short-term perspective. Historical analysis indicates that the stock market's best gains come after an environment has become extremely negative from a sentiment standpoint. Conversely, when sentiment becomes extremely positive, market returns have been subpar.
Intermediate-Term Sentiment Indicator: This is a model-of-models composed of 7 independent sentiment indicators designed to indicate when market sentiment has reached an extreme from a intermediate-term perspective. Historical analysis indicates that the stock market's best gains come after an environment has become extremely negative from a sentiment standpoint. Conversely, when sentiment becomes extremely positive, market returns have been subpar.
Long-Term Sentiment Indicator: This is a model-of-models composed of 6 independent sentiment indicators designed to indicate when market sentiment has reached an extreme from a long-term perspective. Historical analysis indicates that the stock market's best gains come after an environment has become extremely negative from a sentiment standpoint. Conversely, when sentiment becomes extremely positive, market returns have been subpar.
NOT INVESTMENT ADVICE. The opinions and forecasts expressed herein are those of Mr. David Moenning and Heritage Capital Research and may not actually come to pass. The opinions and viewpoints regarding the future of the markets should not be construed as recommendations. The analysis and information in this report is for informational purposes only. No part of the material presented in this report is intended as an investment recommendation or investment advice. Neither the information nor any opinion expressed constitutes a solicitation to purchase or sell securities or any investment program.
Any investment decisions must in all cases be made by the reader or by his or her investment adviser. Do NOT ever purchase any security without doing sufficient research. There is no guarantee that the investment objectives outlined will actually come to pass. All opinions expressed herein are subject to change without notice. Neither the editor, employees, nor any of their affiliates shall have any liability for any loss sustained by anyone who has relied on the information provided.
Mr. Moenning of Heritage Capital Research is an investment adviser representative of Eastsound Capital Advisors, LLC, a registered investment advisor. The adviser may not transact business in states where it is not appropriately registered, excluded or exempted from registration. Individualized responses to persons that involve either the effecting of transaction in securities, or the rendering of personalized investment advice for compensation, will not be made without registration or exemption.
Mr. Moenning and Heritage Capital Research may at times have positions in the securities referred to and may make purchases or sales of these securities while publications are in circulation. Positions may change at any time.
The analysis provided is based on both technical and fundamental research and is provided "as is" without warranty of any kind, either expressed or implied. Although the information contained is derived from sources which are believed to be reliable, they cannot be guaranteed.
The author neither endorses nor warrants the content of this site, any embedded advertisement, or any linked resource. The author or his managed funds may hold either long or short positions in the referenced securities. Republication rights must be expressly granted by author in writing.
Investments in equities carry an inherent element of risk including the potential for significant loss of principal. Past performance is not an indication of future results.