Positives Outweighing Negatives (For Now)
What a difference a week can make, eh? One minute traders are freaking out (as in the 603 point dive registered by the DJIA on Friday, January 31st) over the potential impact of the Coronavirus on the global economy. And the next week, the major stock market indices are hitting new highs. Makes perfect sense, right?
No, the spread of the Coronavirus did not suddenly slow. Yes, it appears the virus will indeed impact China's economy. But there were several other developments this past week that caused folks to look on the bright side. Whether or not the good news will be enough to generate a sustainable leg higher from here is anybody's guess. However, I believe it is important to understand why Ms. Market is acting the way she is.
Global Green Shoots
The first part of the rally formula appears to be confirmation that the global economy is improving (or, at the very least, has stopped declining). Exhibit A in this argument comes from Ned Davis Research, who informed us last week that the Global Manufacturing PMI rose again in January, which represented a third straight monthly increase. NDR's Alejandra Grindal says their work, "found that the global manufacturing PMI tends to bottom a median of four months before the end of global economic slowdowns. Now that we're six months away from the low, history suggests a confirmed recovery."
Ms. Grindal also reported, "the share of individual-country PMIs in expansion territory (i.e., above 50) rose to 53%, an eight-month high. Our calculation of monthly breadth jumped to 65%, indicating that nearly two-thirds of countries saw their PMIs rise month to month, the most since November 2016."
So, while the Coronavirus will likely impact on China's economy, the reports I've read suggest that (a) the downturn will be temporary and (b) economic activity will rebound once the virus is contained. And with the global economy showing improvement, I can understand while macro-oriented investors may be looking on the bright side.
Don't Fight The Central Bankers
If traders learned anything since the US Financial Crisis in 2008 and ensuing European Banking Crises in the early 2010's, it was that when central bankers are trying to stimulate their economies, you buy risk assets. So, when news hit that China is talking about stimulative measures, well, traders knew which buttons to push.
U.S. Data B.T.E.
By now everybody on the planet knows that the U.S. manufacturing sector is hurting. While the administration's tax cuts helped the economy reach escape velocity, my view is the nearly 2-year trade war and the accompanying uncertainty had the opposite effect. The net result has been a weak manufacturing sector and a meaningful slowdown in GDP. In other words, I feel the administration shot itself in the economic foot.
However, the U.S. consumer never faltered through the trade spats and as such, the U.S. economy has been able to keep on keepin' on. We got some good news on this front last week as the ISM Non-Manufacturing (i.e. the Services sector) report came in better than expected. The composite was reported at 55.5 which was above expectations and a five-month high.
Then Came The Job Numbers
Sticking with the theme of strong U.S. data, you are likely aware that both the ADP and BLS Jobs reports beat the pants off consensus expectations.
First up, ADP reported that private sector jobs surged by 291,000 in January. This was nearly double the expectations for 150,000 and the biggest gain seen since May 2015.
Next up, the BLS reported that Nonfarm Payrolls in the U.S. grew by 225,000 in January, which was well above the expectations for 158,000. In addition, the totals for the prior two months were also revised higher. A big part of the jobs story here is that the labor force swelled by 574,000, which pushed the participation rate to the highest rate since June 2013 and the Prime-age participation rate to the best reading since September 2008.
Wait, Tariffs Can Go Down?
Another contributing factor to last week's surprise joyride to the upside was Thursday's report that China will cut retaliatory tariffs on $75 billion of U.S. goods in half. This gave investors hope that the negativity from the trade war with China might be behind us for good, sending the S&P 500 to new all-time highs in the process.
Then The News Went The Other Way
However, the happy vibe on Wall Street took a hit on Friday as the news flow went the other way. First, we got disappointing economic data out of Europe. Next, there was word that JPMorgan had dropped their numbers on China's GDP. There were more negative headlines on the virus. And finally, there was the idea that Friday's strong jobs report would put the kibosh on the potential for further Fed rate cuts.
From my seat, that last item seems kinda silly. In a report released Friday, the Fed suggested that things were looking up. The report stated, "Downside risks to the U.S. outlook seem to have receded in the latter part of the year, as the conflicts over trade policy diminished somewhat, economic growth abroad showed signs of stabilizing, and financial conditions eased."
The Fed also wrote that the U.S. job market and consumer spending remained strong, and "the likelihood of a recession occurring over the next year has fallen noticeably in recent months."
In sum, the Fed said that risks to the U.S. recovery seemed to be easing following the recent rate cuts and evidence that a worldwide dip in trade and manufacturing "appears to be at an end."
Sifting through the Fedspeak here, Friday's report seems to indicate that the Fed has no intention - nor any justification - for cutting rates any further.
Where To From Here?
So, let's review. A week ago, stocks were oversold, and some fear was starting to creep in. The question at the end of January was, how low would the market go during the current pullback/correction/sloppy phase? One week later, stocks are now overbought again and the major indices are one day removed from fresh all-time highs. Thus, from my perch, the question now appears to be, will the bulls be able to break on through to the other side and begin a new leg higher? Or will investors get a reality check and be stuck with a range-bound market for a spell?
While I don't manage money based on my views, predictions, or gut hunches, my gun-to-the-head take is the appropriate trading strategy here is to "ride the range." In other words, unless/until the bulls can produce a confirmed breakout, selling the rips and buying the dips would seem to be the best way to play here.
However, this approach is for traders only. For longer-term investors looking to stay in tune with the market's primary trend, the game plan hasn't changed. In short, our indicators suggest that investors should stay seated on the bull train and use corrections/pullbacks/sloppy periods to add to positions.
Weekly Market Model Review
Since it's the start of a new week, it's now time to put aside my subjective view of the action and to review the "state" of our indicator boards. Each week we do a disciplined, deep dive into our key market indicators and models. The overall goal of this exercise is to (a) remove emotion from the investment process, (b) stay "in tune" with the primary market cycles, and (c) remain cognizant of the risk/reward environment.
The Major Market Models
We start with six of our favorite long-term market models. These models are designed to help determine the "state" of the overall market.
There are a couple changes to report on the Primary Cycle board this week. Both the Leading Indicators and Desert Island Model downticked to neutral from positive, albeit by slim margins. As such, it is important to note that conditions are not as strong as they were at the beginning of the year. The good news is that we are starting to see some improvement in the economic indicators, which would go a long way in restoring the market's overall health. At this stage, I believe the board continues to suggest that the bulls should be given the benefit of the doubt.
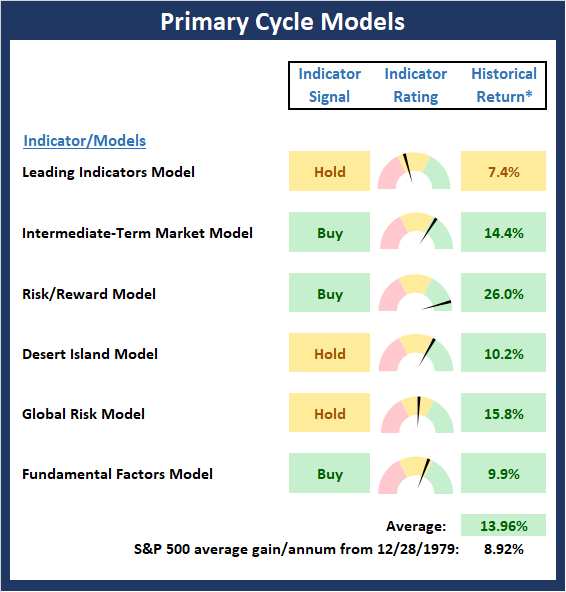
* Source: Ned Davis Research (NDR) as of the date of publication. Historical returns are hypothetical average annual performances calculated by NDR. Past performances do not guarantee future results or profitability - NOT INDIVIDUAL INVESTMENT ADVICE.
View My Favorite Market Models Online
The State of the Fundamental Backdrop
Next, we review the market's fundamental factors in the areas of interest rates, the economy, inflation, and valuations.
The Fundamental Factors board is unchanged again this week. With only one negative component - valuation, which historically has been a simply awful timing indicator - I continue to believe the board remains moderately positive. And since the hypothetical average return of the S&P given the current readings of the board remains higher than the historical mean, the bulls remain in charge of the game.
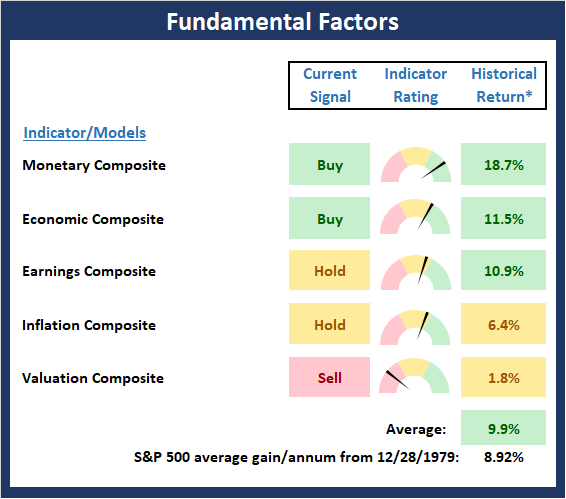
* Source: Ned Davis Research (NDR) as of the date of publication. Historical returns are hypothetical average annual performances calculated by NDR. Past performances do not guarantee future results or profitability - NOT INDIVIDUAL INVESTMENT ADVICE.
View Fundamental Indicator Board Online
The State of the Trend
After looking at the big-picture models and the fundamental backdrop, I like to look at the state of the trend. This board of indicators is designed to tell us about the overall technical health of the current trend.
At this time last week, it looked like stocks were entrenched in a pullback/corrective phase. What a difference a week can make though as additional stimulus in places like China appear to overwhelmed the fears of the Coronavirus negatively impacting global economic growth. However, with stocks once again overbought from a near-term perspective, I can't help but think that we may not have heard the end of the growth concerns. We shall see.
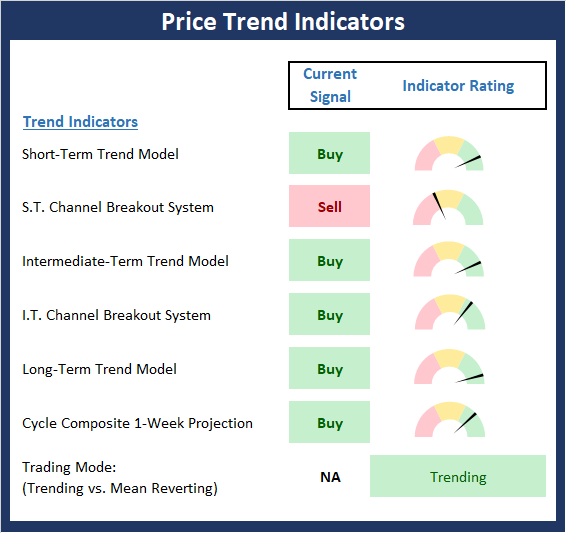
NOT INDIVIDUAL INVESTMENT ADVICE.
View Trend Indicator Board Online
The State of Internal Momentum
Next, we analyze the "oomph" behind the current trend via our group of market momentum indicators/models.
The Momentum board improved a bit this week as both our volume and breadth thrust indicators managed to move up and out of the red zone. However, with a breakout looking a bit iffy and the status of the Momentum board not exactly strong, I think the jury is still out on whether the bulls will be able to power higher from here. I'm not saying it can't happen, I'm simply stating that there isn't a lot of "mo" at this point in time.
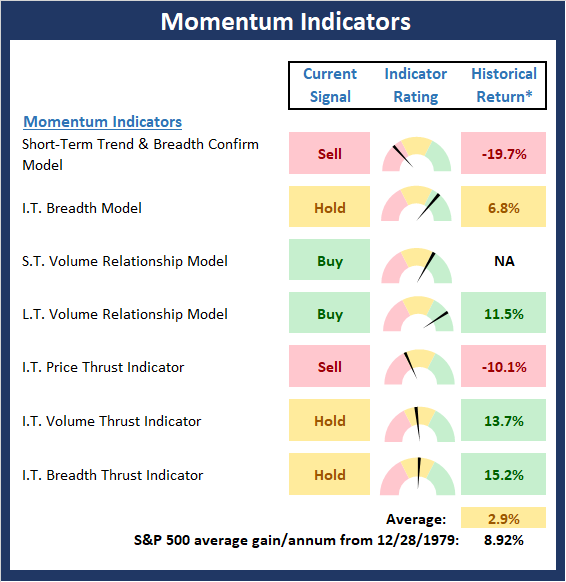
* Source: Ned Davis Research (NDR) as of the date of publication. Historical returns are hypothetical average annual performances calculated by NDR. Past performances do not guarantee future results or profitability - NOT INDIVIDUAL INVESTMENT ADVICE.
View Momentum Indicator Board Online
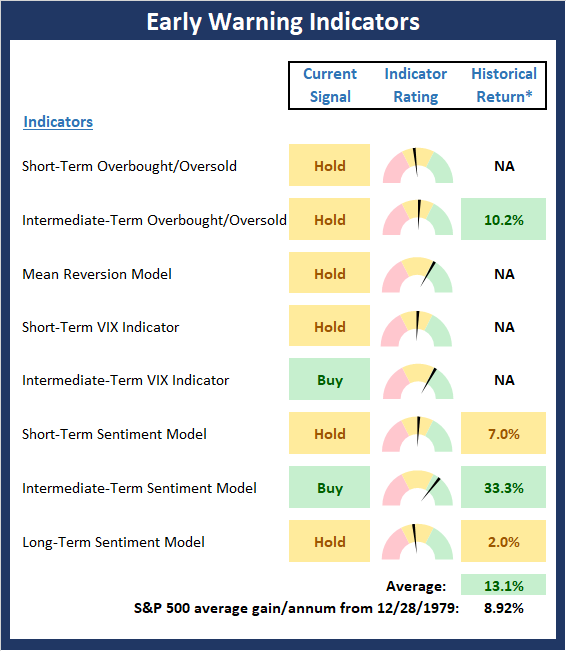
Early Warning Signals
Once we have identified the current environment, the state of the trend, and the degree of momentum behind the move, we then review the potential for a counter-trend move to begin. This batch of indicators is designed to suggest when the table is set for the trend to "go the other way."
Last week, I opined that the Early Warning board told traders to get ready to buy. While I didn't really expect for stocks to turn on a dime, I can say that the Early Warning board once again did a nice job of alerting us of the potential for traders to "go the other way." Currently, the board is largely neutral. However, I will note that some of our shorter-term indicators are very close to flashing sell signals. The bottom line is neither team has the Early Warning wind at their back here. As such, it's "game on" for control of the game here.
* Source: Ned Davis Research (NDR) as of the date of publication. Historical returns are hypothetical average annual performances calculated by NDR. Past performances do not guarantee future results or profitability - NOT INDIVIDUAL INVESTMENT ADVICE.
View Early Warning Indicator Board Online
Thought For The Day:
Let's make lying bad again! - Bumper Sticker
Wishing you green screens and all the best for a great day,

David D. Moenning
Founder, Chief Investment Officer
Heritage Capital Research

Disclosures
At the time of publication, Mr. Moenning held long positions in the following securities mentioned: None - Note that positions may change at any time.
Leading Indicators Model: A group of indicators that have historically shown tendencies to lead the market at major turning points.
Intermediate-Term Market Model: A composite model (model of models) focused on trend and momentum indicators which has been designed to provide identify intermediate-term trading opportunities.
Risk/Reward Model: A model-of-models intended to provide an overall view of the state of the risk/reward environment. The model includes tape, monetary, and sentiment indicators as well as 7 big-picture market model readings.
Desert Island Model: If I was stranded on a desert island with access to only one market model to manage money with, this would be the model. The model is a comprehensive model-of-models comprised of trend, momentum, mean reversion, economic, monetary, sentiment, and factor-based indicators/models.
External Factors Model: A model-of-models designed to provide a reading on the "macro state" of the market environment. The model is comprised of indicators/models in the areas of various index yields, industrial production, investors sentiment, and historic volatility.
Short-Term Trend-and-Breadth Signal Explained: History shows the most reliable market moves tend to occur when the breadth indices are in gear with the major market averages. When the breadth measures diverge, investors should take note that a trend reversal may be at hand. This indicator incorporates NDR's All-Cap Dollar Weighted Equity Series and A/D Line. From 1998, when the A/D line is above its 5-day smoothing and the All-Cap Equal Weighted Equity Series is above its 25-day smoothing, the equity index has gained at a rate of +32.5% per year. When one of the indicators is above its smoothing, the equity index has gained at a rate of +13.3% per year. And when both are below, the equity index has lost +23.6% per year.
Channel Breakout System Explained: The short-term and intermediate-term Channel Breakout Systems are modified versions of the Donchian Channel indicator. According to Wikipedia, "The Donchian channel is an indicator used in market trading developed by Richard Donchian. It is formed by taking the highest high and the lowest low of the last n periods. The area between the high and the low is the channel for the period chosen."
Intermediate-Term Trend-and-Breadth Signal Explained: This indicator incorporates NDR's All-Cap Dollar Weighted Equity Series and A/D Line. From 1998, when the A/D line is above its 45-day smoothing and the All-Cap Equal Weighted Equity Series is above its 45-day smoothing, the equity index has gained at a rate of +17.6% per year. When one of the indicators is above its smoothing, the equity index has gained at a rate of +6.5% per year. And when both are below, the equity index has lost -1.3% per year.
Cycle Composite Projections: The cycle composite combines the 1-year Seasonal, 4-year Presidential, and 10-year Decennial cycles. The indicator reading shown uses the cycle projection for the upcoming week.
Trading Mode Indicator: This indicator attempts to identify whether the current trading environment is "trending" or "mean reverting." The indicator takes the composite reading of the Efficiency Ratio, the Average Correlation Coefficient, and Trend Strength models.
Volume Relationship Models: These models review the relationship between "supply" and "demand" volume over the short- and intermediate-term time frames.
Price Thrust Model Explained: This indicator measures the 3-day rate of change of the Value Line Composite relative to the standard deviation of the 30-day average. When the Value Line's 3-day rate of change have moved above 0.5 standard deviation of the 30-day average ROC, a "thrust" occurs and since 2000, the Value Line Composite has gained ground at a rate of +20.6% per year. When the indicator is below 0.5 standard deviation of the 30-day, the Value Line has lost ground at a rate of -10.0% per year. And when neutral, the Value Line has gained at a rate of +5.9% per year.
Volume Thrust Model Explained: This indicator uses NASDAQ volume data to indicate bullish and bearish conditions for the NASDAQ Composite Index. The indicator plots the ratio of the 10-day total of NASDAQ daily advancing volume (i.e., the total volume traded in stocks which rose in price each day) to the 10-day total of daily declining volume (volume traded in stocks which fell each day). This ratio indicates when advancing stocks are attracting the majority of the volume (readings above 1.0) and when declining stocks are seeing the heaviest trading (readings below 1.0). This indicator thus supports the case that a rising market supported by heavier volume in the advancing issues tends to be the most bullish condition, while a declining market with downside volume dominating confirms bearish conditions. When in a positive mode, the NASDAQ Composite has gained at a rate of +38.3% per year, When neutral, the NASDAQ has gained at a rate of +13.3% per year. And when negative, the NASDAQ has lost at a rate of -14.279% per year.
Breadth Thrust Model Explained: This indicator uses the number of NASDAQ-listed stocks advancing and declining to indicate bullish or bearish breadth conditions for the NASDAQ Composite. The indicator plots the ratio of the 10-day total of the number of stocks rising on the NASDAQ each day to the 10-day total of the number of stocks declining each day. Using 10-day totals smooths the random daily fluctuations and gives indications on an intermediate-term basis. As expected, the NASDAQ Composite performs much better when the 10-day A/D ratio is high (strong breadth) and worse when the indicator is in its lower mode (weak breadth). The most bullish conditions for the NASDAQ when the 10-day A/D indicator is not only high, but has recently posted an extreme high reading and thus indicated a thrust of upside momentum. Bearish conditions are confirmed when the indicator is low and has recently signaled a downside breadth thrust. In positive mode, the NASDAQ has gained at a rate of +22.1% per year since 1981. In a neutral mode, the NASDAQ has gained at a rate of +14.5% per year. And when in a negative mode, the NASDAQ has lost at a rate of -6.4% per year.
Short-Term Overbought/sold Indicator: This indicator is the current reading of the 14,1,3 stochastic oscillator. When the oscillator is above 80 and the %K is above the %D, the indicator gives an overbought reading. Conversely, when the oscillator is below 20 and %K is below its %D, the indicator is oversold.
Intermediate-Term Overbought/sold Indicator: This indicator is a 40-day RSI reading. When above 57.5, the indicator is considered overbought and wnen below 45 it is oversold.
Mean Reversion Model: This is a diffusion model consisting of five indicators that can produce buy and sell signals based on overbought/sold conditions.
VIX Indicator: This indicators looks at the current reading of the VIX relative to standard deviation bands. When the indicator reaches an extreme reading in either direction, it is an indication that a market trend could reverse in the near-term.
Short-Term Sentiment Indicator: This is a model-of-models composed of 18 independent sentiment indicators designed to indicate when market sentiment has reached an extreme from a short-term perspective. Historical analysis indicates that the stock market's best gains come after an environment has become extremely negative from a sentiment standpoint. Conversely, when sentiment becomes extremely positive, market returns have been subpar.
Intermediate-Term Sentiment Indicator: This is a model-of-models composed of 7 independent sentiment indicators designed to indicate when market sentiment has reached an extreme from a intermediate-term perspective. Historical analysis indicates that the stock market's best gains come after an environment has become extremely negative from a sentiment standpoint. Conversely, when sentiment becomes extremely positive, market returns have been subpar.
Long-Term Sentiment Indicator: This is a model-of-models composed of 6 independent sentiment indicators designed to indicate when market sentiment has reached an extreme from a long-term perspective. Historical analysis indicates that the stock market's best gains come after an environment has become extremely negative from a sentiment standpoint. Conversely, when sentiment becomes extremely positive, market returns have been subpar.
Absolute Monetary Model Explained: The popular cliche, "Don't fight the Fed" is really a testament to the profound impact that interest rates and Fed policy have on the market. It is a proven fact that monetary conditions are one of the most powerful influences on the direction of stock prices. The Absolute Monetary Model looks at the current level of interest rates relative to historical levels and Fed policy.
Relative Monetary Model Explained: The "relative" monetary model looks at monetary indicators relative to recent levels as well as rates of change and Fed Policy.
Economic Model Explained: During the middle of bull and bear markets, understanding the overall health of the economy and how it impacts the stock market is one of the few truly logical aspects of the stock market. When our Economic model sports a "positive" reading, history (beginning in 1965) shows that stocks enjoy returns in excess of 21% per year. Yet, when the model's reading falls into the "negative" zone, the S&P has lost nearly -25% per year. However, it is vital to understand that there are times when good economic news is actually bad for stocks and vice versa. Thus, the Economic model can help investors stay in tune with where we are in the overall economic cycle.
Inflation Model Explained: They say that "the tape tells all." However, one of the best "big picture" indicators of what the market is expected to do next is inflation. Simply put, since 1962, when the model indicates that inflationary pressures are strong, stocks have lost ground. Yet, when inflationary pressures are low, the S&P 500 has gained ground at a rate in excess of 13%. The bottom line is inflation is one of the primary drivers of stock market returns.
Valuation Model Explained: If you want to get analysts really riled up, you need only to begin a discussion of market valuation. While the question of whether stocks are overvalued or undervalued appears to be a simple one, the subject is actually extremely complex. To simplify the subject dramatically, investors must first determine if they should focus on relative valuation (which include the current level of interest rates) or absolute valuation measures (the more traditional readings of Price/Earnings, Price/Dividend, and Price/Book Value). We believe that it is important to recognize that environments change. And as such, the market's focus and corresponding view of valuations are likely to change as well. Thus, we depend on our Valuation Models to help us keep our eye on the ball.
Disclosures
NOT INVESTMENT ADVICE. The opinions and forecasts expressed herein are those of Mr. David Moenning and Heritage Capital Research and may not actually come to pass. The opinions and viewpoints regarding the future of the markets should not be construed as recommendations. The analysis and information in this report is for informational purposes only. No part of the material presented in this report is intended as an investment recommendation or investment advice. Neither the information nor any opinion expressed constitutes a solicitation to purchase or sell securities or any investment program.
Any investment decisions must in all cases be made by the reader or by his or her investment adviser. Do NOT ever purchase any security without doing sufficient research. There is no guarantee that the investment objectives outlined will actually come to pass. All opinions expressed herein are subject to change without notice. Neither the editor, employees, nor any of their affiliates shall have any liability for any loss sustained by anyone who has relied on the information provided.
Mr. Moenning of Heritage Capital Research is an investment adviser representative of Eastsound Capital Advisors, LLC, a registered investment advisor. The adviser may not transact business in states where it is not appropriately registered, excluded or exempted from registration. Individualized responses to persons that involve either the effecting of transaction in securities, or the rendering of personalized investment advice for compensation, will not be made without registration or exemption.
Mr. Moenning and Heritage Capital Research may at times have positions in the securities referred to and may make purchases or sales of these securities while publications are in circulation. Positions may change at any time.
The analysis provided is based on both technical and fundamental research and is provided "as is" without warranty of any kind, either expressed or implied. Although the information contained is derived from sources which are believed to be reliable, they cannot be guaranteed.
The author neither endorses nor warrants the content of this site, any embedded advertisement, or any linked resource. The author or his managed funds may hold either long or short positions in the referenced securities. Republication rights must be expressly granted by author in writing.
Investments in equities carry an inherent element of risk including the potential for significant loss of principal. Past performance is not an indication of future results.