Post Crash Behavior and What To Expect Next
Paul Schatz of Heritage Capital, LLC is filling in for Dave M. this morning. We are pleased to be able to offer Paul's thoughts on the state of the market and hope that you enjoy his views.
The day before Flash Crash II last week, I opined that the bottoming process could begin as early as last week. From my seat, it did. One week removed from the mini crash or crashette and stocks took it hard on the chin again. China was blamed, but that’s only a cover story and coincidence. However, unlike August 24, we did not see another Flash Crash. There was no panic. The selling was fairly orderly, which can be viewed as a good thing and a not so good thing. Volume was on the light side. Market internals were abhorrent.
In short, stocks are shaking out from mini crash type action according to history. Of all the declines since the bull market launched in 2009, including the 20% one in 2011, the current correction gives the bears the most ammunition to claim that a new bear market has started. But before you jump to conclusions, read on…
I remain steadfast that while the bull market may continue to be old, wrinkly and not exactly the pillar of health, it is nonetheless alive. That’s the same conclusion I have drawn during each and every decline since 2010. The final peak lies ahead of us and that’s very likely to be north of 20,000 on the Dow.
I know. I know. I am crazy.
Who in their right mind would forecast fresh all-time highs ahead, let alone Dow 20,000 with China imploding and global recession supposedly all but a certainty. And there is always a risk I am wrong, but I do love being in a camp by myself!
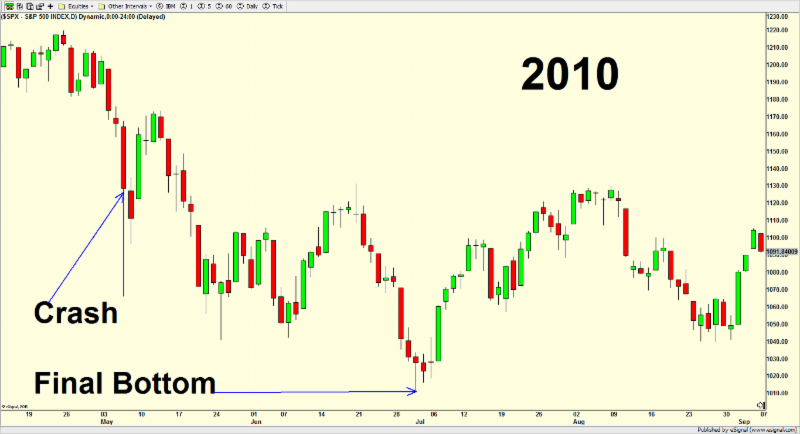
So getting back to the action since August 24, you can see a few different ways in light green arrows on the chart below on how this bottoming action may play out. I chose those paths by looking at other similar action. There weren’t many over the past 30 years where a bull market peak was so close. That was criteria number one. The bull market peak was within two months of the crash.
Defining the actual crash isn’t as easy. It’s easy to spot in hindsight and you can certainly feel it when it’s happening. It’s rapid downside acceleration without any intervening rallies that usually leads to a 3%+ down day at the end.
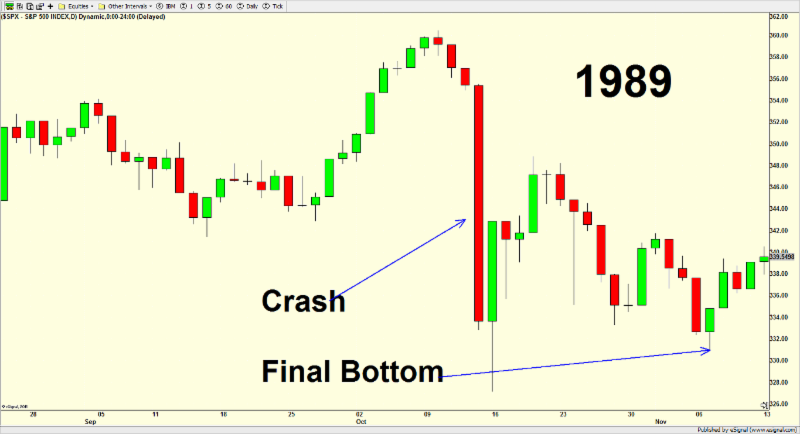
 I am going to take you through each occurrence to compare and contrast starting with the most recent. The years will be listed on each chart along with the “crash”, one of the most overused words in investing lexicon, and then where the final bottom was before stocks took off again to the upside.
On the surface, 2011 and 2015 look very similar although the decline in 2011 was more damaging and deeper. It took roughly six weeks to bottom.

2010 is next. That’s where we saw the first Flash Crash which doesn’t seem all that bad on the surface. This week’s action looks very similar to the three day rally immediately after the Flash Crash. The final bottom was eight weeks later and at prices significantly below the crash, something very unusual.
1998 is next and that looks exactly like what we saw in 2011. In fact, I wrote an article after the crash in 2011 forecasting that the final bottom would be a mirror image of the 1998 decline. In both instances, the decline was more than 20% and the final bottom was six weeks after the crash.

1997 is below and that crash behavior doesn’t really behave like the rest. Stocks pulled back a little, but the crash was essentially a one day decline that was sharply reversed the very next day.

1994 is next and while the decline was not even 10%, the post crash action was very similar to most other periods. I marked the final bottom 11 weeks later because that was low from which stocks finally rallied, but you can certainly argue that it was right at the day of the crash.

1989 has some similarities to 1997 in that it was essentially a one day outlier decline based on the leveraged buyout craze imploding with takeovers in United and American Airlines falling apart with Donald Trump involved. The bottoming process was fairly quick and not very painful with the final bottom occurring roughly four weeks later.
Finally, the greatest crash of the modern investing era was seen in 1987. Similar to 9/11, most people remember where they were and what they thought as the day unfolded. I recall my father launching a new discount brokerage business that very day. While I thought the timing could not have been worse, he often said that it was perfect since none of his clients lost any money on that day as there were no clients yet!
As with most of the other crash periods, the final bottom was seen some weeks later, six in this case.

Crashes, mini crashes, crashettes are all very emotional events. The most panic is typically seen during the crash when the market makes its internal or momentum low. There is usually a rally and subsequent final bottom some weeks later. The only caveat I will add is that the more pervasive the sentiment towards this behavior, the more the market will morph and confound the masses.

Paul Schatz
Paul Schatz is President and Chief Investment Officer of Heritage Capital, LLC, in Woodbridge, CT. and a Managing Partner at Numetrix Capital, an investment research firm focused on multi-manager, multi-strategy portfolio solutions.
This Morning's Pre-Game Indicators
Here are the Pre-Market indicators we review each morning before the opening bell...
Major Foreign Markets:
Japan: +0.48%
Hong Kong: Closed
Shanghai: Closed
London: +1.69%
Germany: +1.60%
France: +1.03%
Italy: +1.42%
Spain: +0.32%
Crude Oil Futures: +$0.01 to $46.26
Gold: -$9.00 at $1124.60
Dollar: higher against the yen, euro, and pound
10-Year Bond Yield: Currently trading at 2.171%
Stock Indices in U.S. (relative to fair value):
S&P 500: +16.35
Dow Jones Industrial Average: +137
NASDAQ Composite: +42.40
Thought For The Day:
"Unthinking respect for authority is the greatest enemy of truth." -Albert Einstein
Current Market Drivers
We strive to identify the driving forces behind the market action on a daily basis. The thinking is that if we can both identify and understand why stocks are doing what they are doing on a short-term basis; we are not likely to be surprised/blind-sided by a big move. Listed below are what we believe to be the driving forces of the current market (Listed in order of importance).
1. The State of China's Currency/Economy
2. The State of Global Economic Growth
3. The State of European Banking System
4. The State of the U.S. Economy
The State of the Trend
We believe it is important to analyze the market using multiple time-frames. We define short-term as 3 days to 3 weeks, intermediate-term as 3 weeks to 3 months, and long-term as 3 months or more. Below are our current ratings of the three primary trends:
Short-Term Trend: Neutral
(Chart below is S&P 500 daily over past 1 month)
Intermediate-Term Trend: Neutral
(Chart below is S&P 500 daily over past 6 months)
Long-Term Trend: Moderately Positive
(Chart below is S&P 500 daily over past 2 years)
Key Technical Areas:
Traders as well as computerized algorithms are generally keenly aware of the important technical levels on the charts from a short-term basis. Below are the levels we deem important to watch today:
- Key Near-Term Support Zone(s) for S&P 500: 2050
- Key Near-Term Resistance Zone(s): 2105-2135
The State of the Tape
Momentum indicators are designed to tell us about the technical health of a trend - I.E. if there is any "oomph" behind the move. Below are a handful of our favorite indicators relating to the market's "mo"...
- Trend and Breadth Confirmation Indicator (Short-Term): Negative
- Price Thrust Indicator: Negative
- Volume Thrust Indicator: Negative
- Breadth Thrust Indicator: Negative
- Intermediate-Term Bull/Bear Volume Relationship: Negative
- Technical Health of 100+ Industry Groups: Moderately Positive
The Early Warning Indicators
Markets travel in cycles. Thus we must constantly be on the lookout for changes in the direction of the trend. Looking at market sentiment and the overbought/sold conditions can provide "early warning signs" that a trend change may be near.
- S&P 500 Overbought/Oversold Conditions:
- Short-Term: Neutral
- Intermediate-Term: Moderately Oversold - Market Sentiment: Our primary sentiment model is Positive .
The State of the Market Environment
One of the keys to long-term success in the stock market is stay in tune with the market's "big picture" environment in terms of risk versus reward.
- Weekly Market Environment Model Reading: Low Neutral
The opinions and forecasts expressed herein are those of Mr. Paul Schatz and may not actually come to pass. Mr. Schatz's opinions and viewpoints regarding the future of the markets should not be construed as recommendations. The analysis and information in this report is for informational purposes only. No part of the material presented in this report is intended as an investment recommendation or investment advice. Neither the information nor any opinion expressed nor any Portfolio constitutes a solicitation to purchase or sell securities or any investment program.
Any investment decisions must in all cases be made by the reader or by his or her investment adviser. Do NOT ever purchase any security without doing sufficient research. There is no guarantee that the investment objectives outlined will actually come to pass. All opinions expressed herein are subject to change without notice. Neither the editor, employees, nor any of their affiliates shall have any liability for any loss sustained by anyone who has relied on the information provided.
The analysis provided is based on both technical and fundamental research and is provided "as is" without warranty of any kind, either expressed or implied. Although the information contained is derived from sources which are believed to be reliable, they cannot be guaranteed.
Paul Schatz, an advisor representative of CONCERT Wealth Management Inc. (CONCERT), is founder of Heritage Capital LLC, a legal business entity(Heritage). Advisory services are offered through CONCERT Wealth Management, Inc., an SEC registered investment advisor. For a complete description of investment risks, fees and services review the CONCERT firm brochure (ADV Part 2) which is available from your Investment Representative or by contacting Heritage or CONCERT.
Heritage Capital a state-registered investment adviser. Heritage also serves as a sub-advisor to other investment advisory firms. Neither Heritage or CONCERT is registered as a broker-dealer.
Employees and affiliates of Heritage may at times have positions in the securities referred to and may make purchases or sales of these securities while publications are in circulation. Editors will indicate whether they or Heritage has a position in stocks or other securities mentioned in any publication. The disclosures will be accurate as of the time of publication and may change thereafter without notice.
Investments in equities carry an inherent element of risk including the potential for significant loss of principal. Past performance is not an indication of future results.