Rocky Road Ahead?

From my seat, the key driver to the stock market game appears to be the outlook for growth. As in what the growth rates for both GDP and corporate earnings will be once we get beyond comparisons to the economic shutdown phase.
As I wrote last time, growth is likely peaking due to the fact that current rates of growth have been "juiced" by all kinds of stimulus and the reopening of the economy. Thus, they are simply unsustainable.
The real key will be what growth looks like AFTER we get past the reopening, the stimulus, the supply chain issues, etc. I'm of the mind that we continue to see "solid growth," which I'll define as a growth rate above where it was pre-pandemic. This would likely create an environment for which stocks could continue to look ahead with an optimistic bent.
However, should growth stumble for some reason, well, some "corrective action" might need to occur. What could cause growth to stumble, you ask? All kinds of things such as a resurgence of COVID, persistent inflation, an external event, etc.
While I realize that I've spent a fair amount of time on the historical cycles this year, I'd like to again review how the market is faring relative to the projections from Ned Davis Research's Cycle Composite. To review, the Cycle Composite is a mashup of all 1-year seasonal cycles, 4-year Presidential cycles, and 10-year decennial cycles back to 1928.
As I've mentioned a time or twenty, while I do use the Cycle Composite as an input to some of my models, I do NOT make investment decisions based on what the composite projection suggests will happen next.
But I wanted to focus on the cycle composite again this week for two reasons. First, the S&P 500 continues to be almost completely in sync with the composite's projection this year. And second, because the cycles suggest a meaningful correction could be just around the corner.
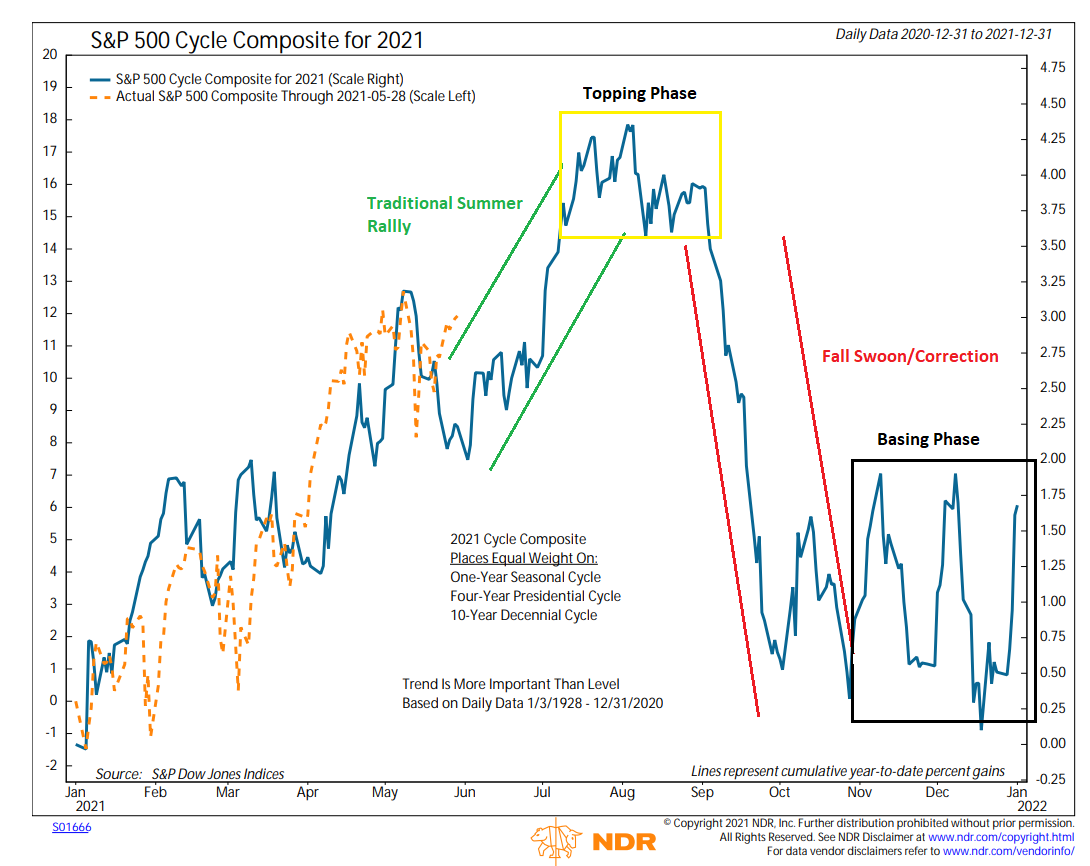
Below is the chart I created at the end of May. At that time, it looked like the market (the dashed line in orange) was front running the traditional summer rally and that higher prices were coming.
The Cycle Composite as of May 28, 2021
View Full Size Chart
* Source: Ned Davis Research
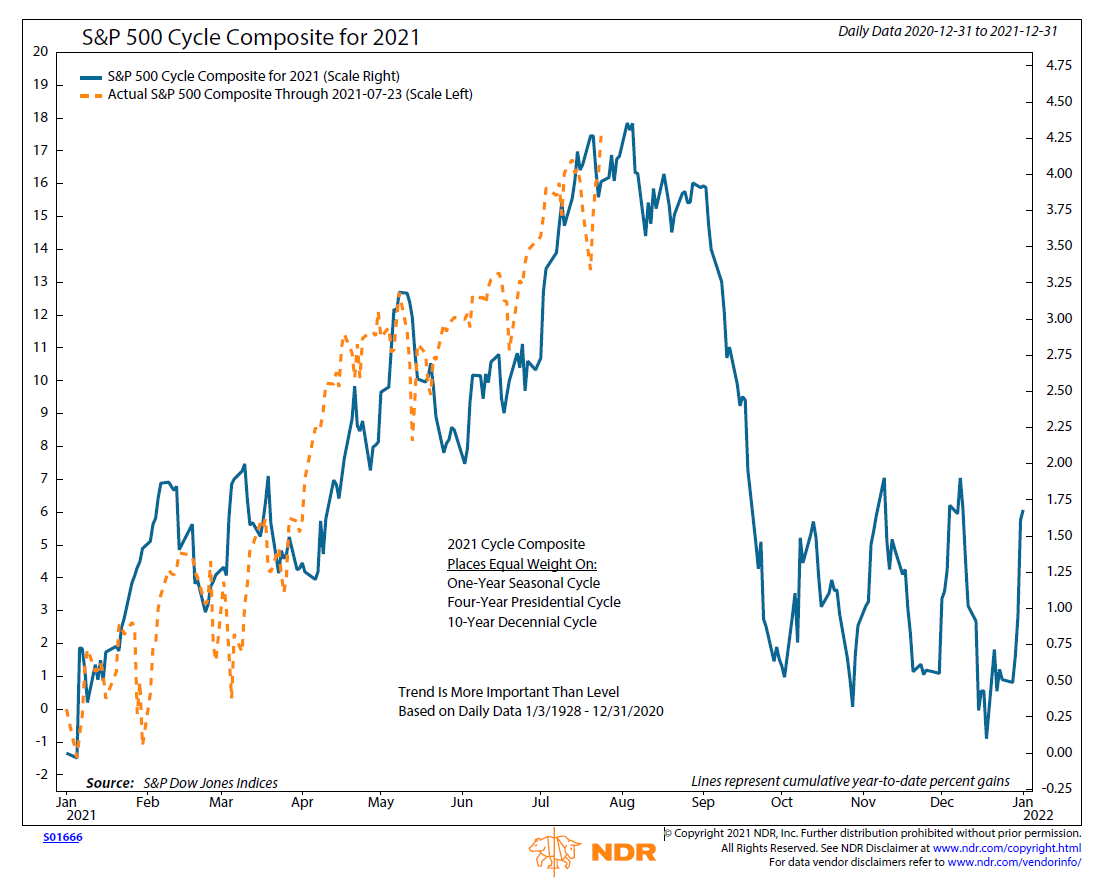
Next is the S&P 500 versus the cycle composite through Friday.
The Cycle Composite as of July 23, 2021
View Full Size Chart
* Source: Ned Davis Research
Sure enough, the summer rally the cycle composite had projected has occurred. Sure, there was a bump or two along the way. But with the orange line almost exactly where the cycle projection suggested it would be at this point of the year, I for one, am certainly paying attention.
As I have mentioned in prior cycle reviews, the market definitely does NOT always follow the cycle composite. There are lots of times when the market diverges wildly from its historical cycles and goes wherever it wants. And that could certainly happen again here.
However, I've found over the years that there are also times when the projection of the Cycle Composite is quite good - as in scary good.
So, given that the market has been almost completely in sync with the historical cycles so far this year, I thought it was worth reiterating that the next important move the cycles are calling for is down.
For what it's worth, I can easily make the argument that the market will likely avoid a meaningful correction in the near-term and that the S&P 500 will diverge from the cycle composite in the next couple of months.
Yet, at the same time, I will be keeping an eye out for any/all reasons/excuses/narratives that might cause traders to rethink their current upbeat positioning.
Here's hoping you have a great week. Now let's review our indicator boards...
The Big-Picture Market Models
We start with six of our favorite long-term market models. These models are designed to help determine the "state" of the overall market.
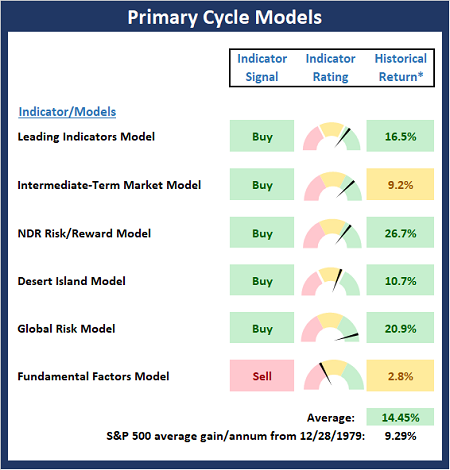
* Source: Ned Davis Research (NDR) as of the date of publication. Historical returns are hypothetical average annual performances calculated by NDR.
The Fundamental Backdrop
Next, we review the market's fundamental factors including interest rates, the economy, earnings, inflation, and valuations.
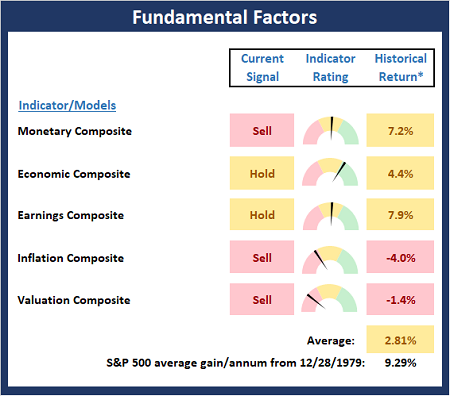
* Source: Ned Davis Research (NDR) as of the date of publication. Historical returns are hypothetical average annual performances calculated by NDR.
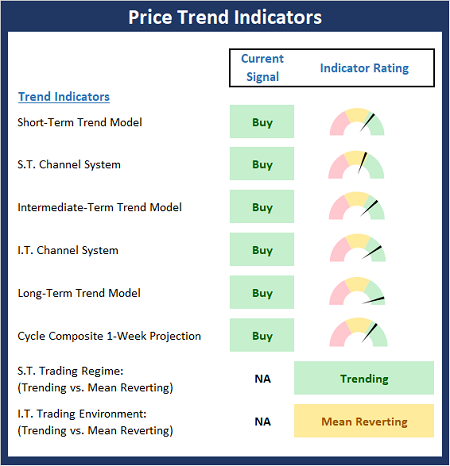
The State of the Trend
After reviewing the big-picture models and the fundamental backdrop, I like to look at the state of the current trend. This board of indicators is designed to tell us about the overall technical health of the market's trend.
The State of Internal Momentum
Next, we analyze the momentum indicators/models to determine if there is any "oomph" behind the current move.
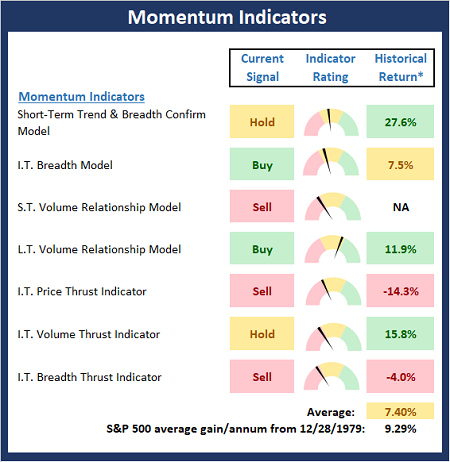
* Source: Ned Davis Research (NDR) as of the date of publication. Historical returns are hypothetical average annual performances calculated by NDR.
Early Warning Signals
Finally, we look at our early warning indicators to gauge the potential for counter-trend moves. This batch of indicators is designed to suggest when the table is set for the trend to "go the other way."
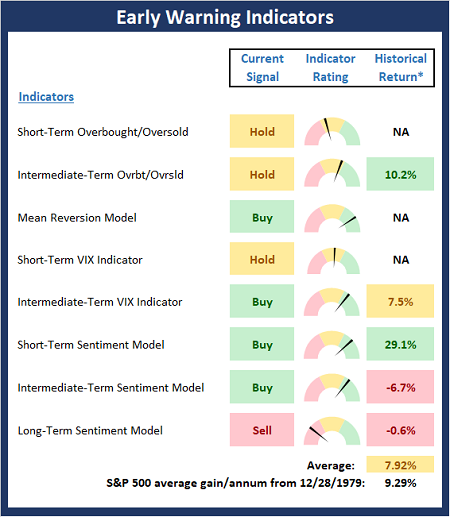
* Source: Ned Davis Research (NDR) as of the date of publication. Historical returns are hypothetical average annual performances calculated by NDR.
Thought for the Day:
One person can make a difference, and everyone should try. -John F Kennedy
Wishing you green screens and all the best for a great day,

David D. Moenning
Founder, Chief Investment Officer
Heritage Capital Research, a Registered Investment Advisor

Disclosures
At the time of publication, Mr. Moenning held long positions in the following securities mentioned: None - Note that positions may change at any time.
NOT INDIVIDUAL INVESTMENT ADVICE. IMPORTANT FURTHER DISCLOSURES