Stocks Ignoring Consumer Angst

While surprising to some (mostly those dressed in their best bear garb), the stock market continues to work its way higher. Appearing to be climbing the proverbial "wall of worry," the S&P 500 just keeps on keepin' on - to the tune of record high closes, that is.
In case you've been living in a cave or away at the beach with the family without cell service, the primary reason for all the new records appears to be pretty simple: earnings. As in really good earnings. Surprisingly good earnings. No, make that really surprisingly good earnings. And while everybody on the planet expected this quarter's parade of corporate results to be strong, what wasn't expected was Corporate America's upbeat outlook about future earnings.
Remember, the stock market doesn't care about what is currently happening - especially when "everybody" knows why it is happening. Hence the phrase, "something everybody knows isn't worth knowing." No, as a "discounting mechanism of future expectations," the stock market cares about what the outlook going forward looks like.
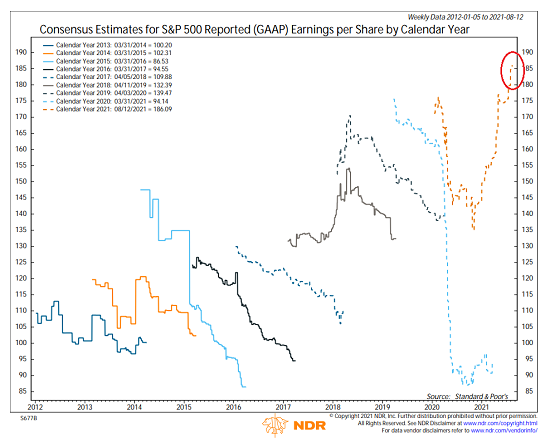
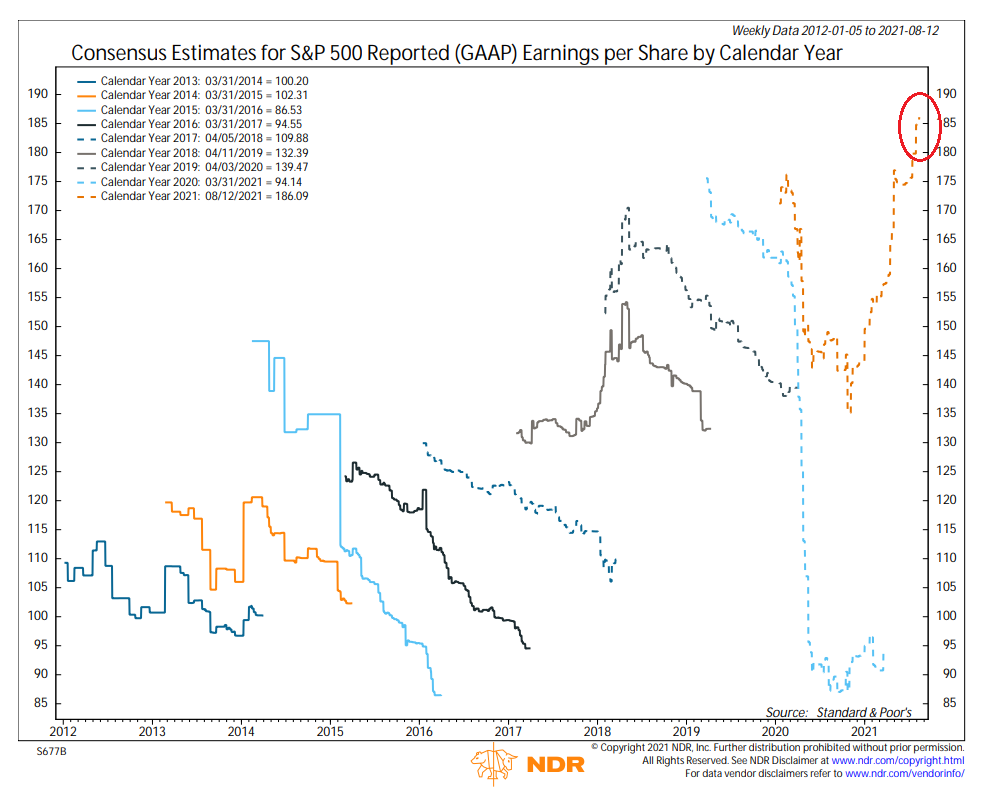
From my perch, the chart below explains why stocks finished last week at record highs. This chart shows the Consensus Earnings Estimates (GAAP earnings, to be precise) for the S&P 500. Please take note of what has happened recently to the estimates for 2021 - the area I’ve circled in red.
View Full Size Chart
* Source: Ned Davis Research
Can you say, surge? As the chart indicates, GAAP EPS Estimates have increased from around $180 to over $186 during this earnings season alone. To me, this means analysts are scrambling to get their estimates in line with reality. And that's a good thing.
But...
However, there is another surge occurring right now that is more than a little disturbing. As in the surge in cases of the Delta variant - and who is being infected. This appears to be causing some angst among consumers.
The next two charts tell this story well. The first chart shows the dramatic drop in visits to retail stores, restaurants, grocery stores, and gyms since the beginning of July.
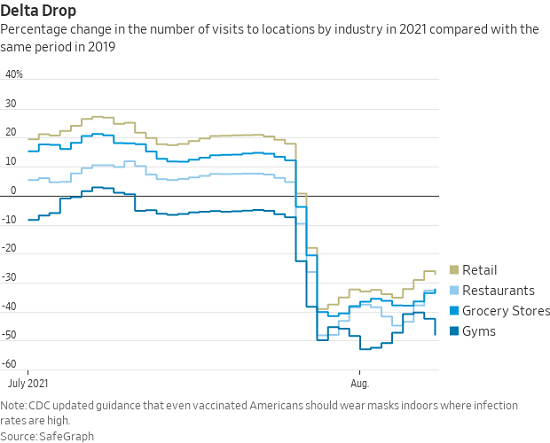
Image Source: WSJ
In short, it looks like concerns over catching the Delta variant (which is reportedly easier to get than the common cold) have put some folks (but clearly not all!) back in some sort of self-induced semi-lockdown mode. No, folks aren't holing up in their homes and hording toilet paper this time around. But it does appear that a fair number of Americans are indeed smart enough to avoid places where it might be easy to catch this thing.
The next chart shows the current mood of the consumer, which basically tanked at a record rate last month as cases of COVID in the U.S. increased more than 10-fold (source: Johns Hopkins 7-day average of cases).
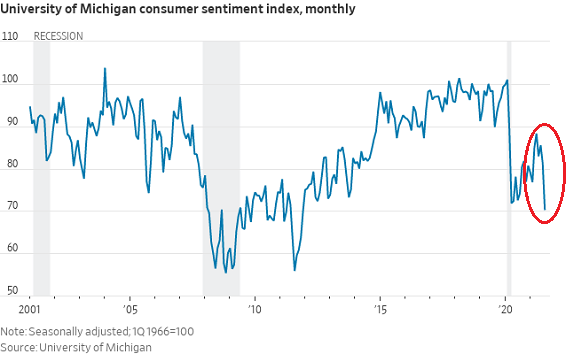
Image Source: WSJ
And lest we forget, the consumer is responsible for upwards of 70% of economic activity in this country. As such, it is pretty easy to argue that the one-way march higher in the stock market could experience some sort of a hiccup at some point in the near future.
So far at least, the consternation consumers appear to be feeling hasn't shown up in the stock market action. But I for one, believe it is reasonable to expect that it certainly could. Thus, some caution might be warranted here - especially as we are now entering the weakest seasonal period of the year.
Here's hoping you have a great week. Now let's review our indicator boards...
The Big-Picture Market Models
We start with six of our favorite long-term market models. These models are designed to help determine the "state" of the overall market.
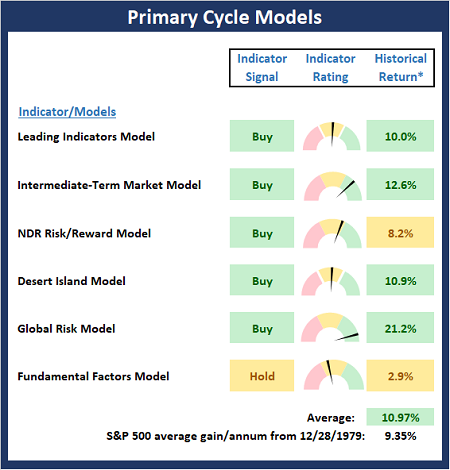
* Source: Ned Davis Research (NDR) as of the date of publication. Historical returns are hypothetical average annual performances calculated by NDR.
The Fundamental Backdrop
Next, we review the market's fundamental factors including interest rates, the economy, earnings, inflation, and valuations.
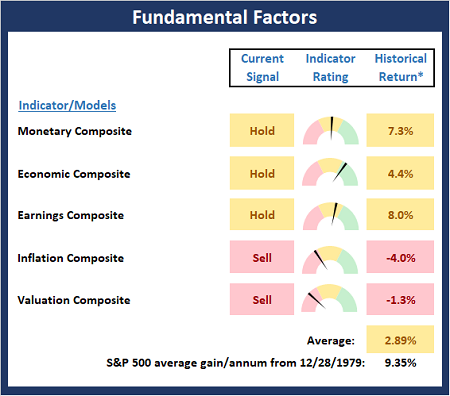
* Source: Ned Davis Research (NDR) as of the date of publication. Historical returns are hypothetical average annual performances calculated by NDR.
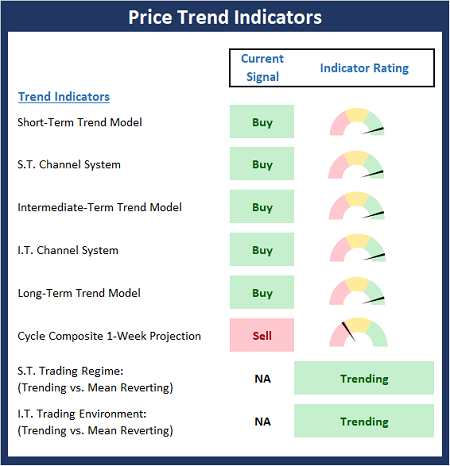
The State of the Trend
After reviewing the big-picture models and the fundamental backdrop, I like to look at the state of the current trend. This board of indicators is designed to tell us about the overall technical health of the market's trend.
The State of Internal Momentum
Next, we analyze the momentum indicators/models to determine if there is any "oomph" behind the current move.
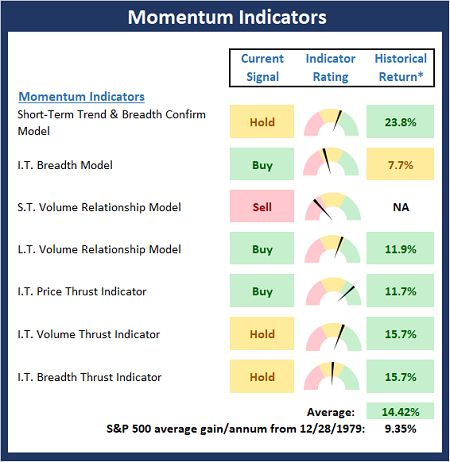
* Source: Ned Davis Research (NDR) as of the date of publication. Historical returns are hypothetical average annual performances calculated by NDR.
Early Warning Signals
Finally, we look at our early warning indicators to gauge the potential for counter-trend moves. This batch of indicators is designed to suggest when the table is set for the trend to "go the other way."
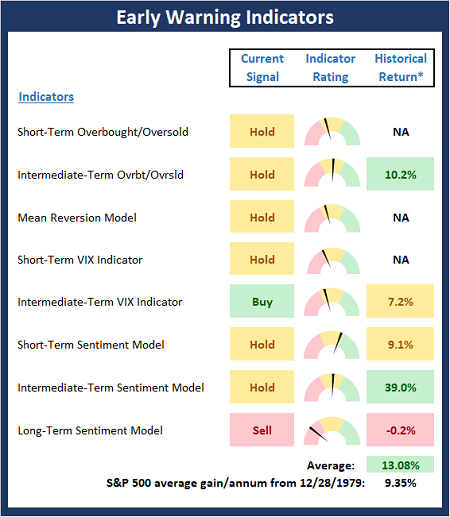
* Source: Ned Davis Research (NDR) as of the date of publication. Historical returns are hypothetical average annual performances calculated by NDR.
Thought for the Day:
When the facts change, I change my mind. What do you do, sir? — John Maynard Keynes
Wishing you green screens and all the best for a great day,

David D. Moenning
Founder, Chief Investment Officer
Heritage Capital Research, a Registered Investment Advisor

Disclosures
At the time of publication, Mr. Moenning held long positions in the following securities mentioned: None - Note that positions may change at any time.
NOT INDIVIDUAL INVESTMENT ADVICE. IMPORTANT FURTHER DISCLOSURES