The Changing Narrative

Volatility appears to be the new normal for calendar year 2022. Lest we forget, the new year began with the S&P 500 moving to a fresh all-time high. Something that investors had become accustomed to in 2021. Things were looking good with the economy reopening and GDP growth looking strong.
But then it happened. Inflation, that is. Surging prices of oil, lumber, food, houses, and, well, just about everything. For a while, nobody seemed to mind. Households were flush with cash thanks to the helicopter money out of Washington and perhaps the loosest/most stimulative Fed policy in recent memory.
Nobody minded seeing the value of their 401K's movin' on up. Everyone liked the shocking increase in the value of their homes. So what if you had to pay a little more for gas and groceries, the "wealth effect" was worth it, right?
And from what we were hearing, the crazy prices of things like used cars and trucks was going to be "transitory." Everything would go back to normal soon enough. Or so we were told.
But then a deranged psychopath desperately seeking relevance and a return to perceived former glory decided to make up a reason to invade his neighbor.
And, just to keep things interesting, COVID decided to make a comeback in China. You know, the place where the Winter Olympics were held and also the place were the pandemic began.
Just like that, everything changed. Suddenly there were new & improved supply chain problems. And shortages of all kinds of stuff, like wheat.
Along the way, the price of gasoline reached levels that raised eyebrows at the pump - especially in places like California. I can distinctly recall the shock when I filled the tank during our trip to La Quinta and the price per gallon started with a $6.
Before you could look up the timeframe that applies to the word "transitory," inflation was a problem.
Gone was the old inflation problem. You remember, right? The problem was that for nearly a decade, inflation was stubbornly low and try as they might, the Fed couldn't achieve their inflation goal.
Until they did, of course. After the US government plunked about $10 trillion in citizen's checking accounts and the Fed made up new ways to expand the money supply and push rates down, we are now dealing with the old kind of inflation problem. A problem that doesn't appear to be very transitory at all.
No, the wage inflation genie appears to be out of the bottle. And when one digs into the formula for inflation they will find that there is a fair number of areas that are likely to keep inflation pretty darn sticky.
So, in keeping with their so-called mandate, the Fed has promised to use all the tools at their disposal to fight this new/old inflation problem.
Enter the age old Wall Street cliche, "Don't fight the Fed." In short, history tells us that stocks don't tend to fare well when the Fed is on a rate-hiking mission. Especially stocks with higher P/E multiples.
So with inflation spiking to 40-year highs and the Fed on the war path, rates have surged. Which made the value of those high multiple companies worth less. And in many cases, a lot less.
Fast forward to this week's action. On Wednesday, stocks enjoyed a sigh-of-relief rally based on the surprise that Powell & Company weren't considering getting even more aggressive - as in 75 bps rate hikes.
Thus, the narrative suddenly shifted. Powell wasn't going to wreck the economy. The Fed was going to be data dependent. And a soft landing (defined as a rate-hiking campaign that does not result in a recession) was actually possible this time around.
Shorts ran for cover. Dip-buyers bombed in. And it felt like things might be okay. As in the worst of the decline might be over. And by the the end of the day, the S&P was up over 3%.
Then came Thursday. Another day, another data point, and another change in the narrative. Oh and another violent reaction in the markets.
Early Thursday morning we got the normally mundane report on Capacity Utilization. To be sure, this bit of economic data isn't on most people's reading list. However, this particular report turned out to be a real eye opener.
Cutting to the chase, worker productive came in well below expectations and Unit Labor Costs (I.E. the cost of those workers) went up - a lot.
Bam. In a heartbeat, the narrative shifted - yes, again. Gone was the warm 'n fuzzies of a soft landing. In its place was the dread of stagflation. And, of course, a lot of fretting about recession.
Fear replaced hope. Selling replaced buying. And before you could confirm that Q1 GDP had come in negative, the markets were having a VERY bad day. A day that reversed all the prior upbeat session's gains. Talk about whipsaw action!
So it goes in this uncertain environment. A market where the narrative is constantly changing. And in turn, so too does the direction of stock and bond prices.
So, can something come out of the woodwork to turn that frown upside down? Of course it can. Maybe Putin will give up. Maybe inflation will show some signs of peaking this week. Maybe the economy won't slow down. And maybe, just maybe, Powell's bunch will decide to back off and/or not take things too far. Any of the above could certainly change the narrative again.
But for now, the narrative is negative and the fear of what may lie ahead has gripped the markets. Uncertainty reigns supreme. As such, traders are selling first and asking questions later. Right or wrong, this is the market we are dealing with. So it is probably best to buckle up and keep those risk mitigation systems engaged. Well, for now, anyway.
Now let's review the "state of the market" through the lens of our market models...
The Big-Picture Market Models
We start with six of our favorite long-term market models. These models are designed to help determine the "state" of the overall market.
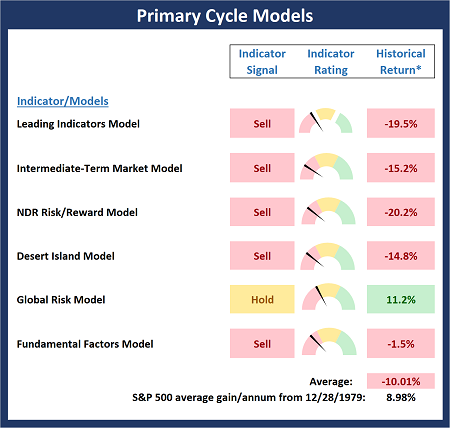
* Source: Ned Davis Research (NDR) as of the date of publication. Historical returns are hypothetical average annual performances calculated by NDR.
The Fundamental Backdrop
Next, we review the market's fundamental factors including interest rates, the economy, earnings, inflation, and valuations.
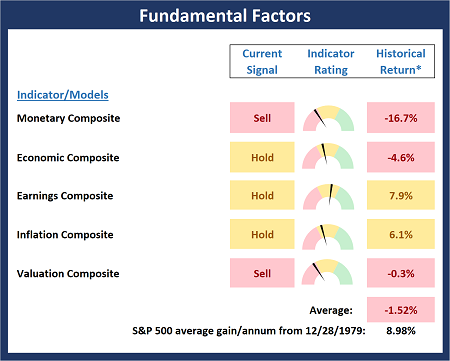
* Source: Ned Davis Research (NDR) as of the date of publication. Historical returns are hypothetical average annual performances calculated by NDR.
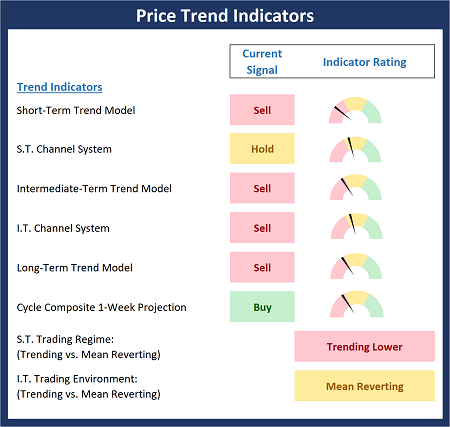
The State of the Trend
After reviewing the big-picture models and the fundamental backdrop, I like to look at the state of the current trend. This board of indicators is designed to tell us about the overall technical health of the market's trend.
The State of Internal Momentum
Next, we analyze the momentum indicators/models to determine if there is any "oomph" behind the current move.
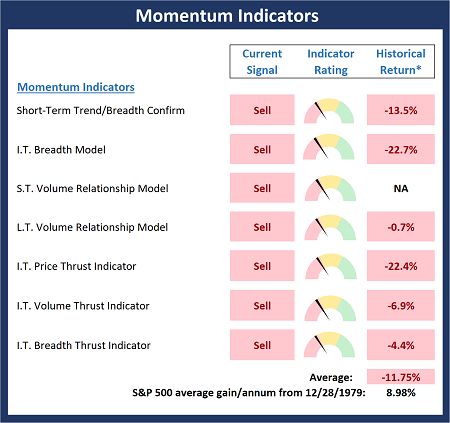
* Source: Ned Davis Research (NDR) as of the date of publication. Historical returns are hypothetical average annual performances calculated by NDR.
Early Warning Indicators
Finally, we look at our early warning indicators to gauge the potential for countertrend moves. This batch of indicators is designed to suggest when the table is set for the trend to "go the other way."
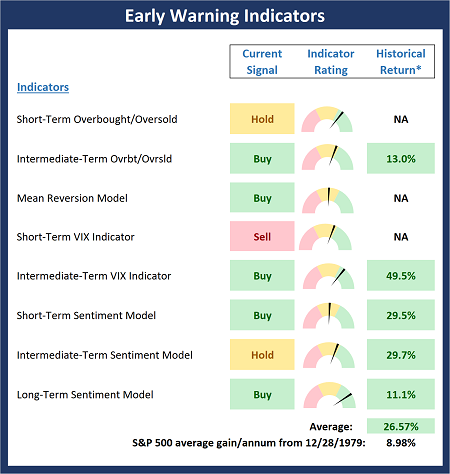
* Source: Ned Davis Research (NDR) as of the date of publication. Historical returns are hypothetical average annual performances calculated by NDR.
Thought for the Day:
True wisdom comes to each of us when we realize how little we understand about life, ourselves, & the world around us. - Socrates
Wishing you green screens and all the best for a great day,

David D. Moenning
Founder, Chief Investment Officer
Heritage Capital Research, a Registered Investment Advisor

Disclosures
At the time of publication, Mr. Moenning held long positions in the following securities mentioned: None - Note that positions may change at any time.
NOT INDIVIDUAL INVESTMENT ADVICE. IMPORTANT FURTHER DISCLOSURES