The Cycle Roadmap for 2024

The drivers of the stock market at this point in the game are fairly clear. The Fed's next move, the state of the economy, and whether or not 2024 earnings can hold up to the rather lofty expectations appear to be the top factors on investors' minds these days.
So far at least, the earnings parade looks to be delivering the goods, albeit in a less than robust way. But in reality, it's the full year EPS estimates that remain one of the keys to stock prices going forward. For example, the current consensus estimates project earnings to grow by 13.05% this year. And the bottom line is - at least from my seat - if companies can deliver that kind of earnings growth, then stock prices ought to be higher, perhaps meaningfully so, by the end of the year.
But, as the bears are quick to counter, analysts aren't exactly known for being able to predict the future with any real degree of accuracy. In fact, estimates for an upcoming calendar year have historically been consistently too rosy and as a result, tend to be adjusted downward as the year progresses. So we shall see.
Then there is Jay Powell and his merry band of central bankers. Will they or won't they? had been the key question for many moons. And by now, we know the answer is, "yes" - it's just a question of when and by how much the FOMC is going to cut rates in 2024. Again, investors will have to wait and see when the Fed begins its next phase of monetary policy.
And finally there is the subject of the economy. Will the naysayers finally be "right" on their incessant calls for recession? Or will the economy continue to hum along on the back of consumers that still love to spend and a strong labor market? So far so good here, but it's a long year.
So, while we wait for some clarity on these topics, I thought it might be a good idea to take a look at what the historical cycles look like for the rest of the coming year.
Long-time readers know that these historical cycles can oftentimes be an excellent roadmap for what to expect next in Ms. Market's game. But as is the case with so many indicators, there are other times when stock prices wander into uncharted territory.
In my experience, one can never invest based on any one indicator. However, having an idea of what the overall trend might be in the year ahead can be helpful as the year unfolds.
So, without further ado, let's take a look at the various cycle projections for 2024.
The Cycle Composite for 2024
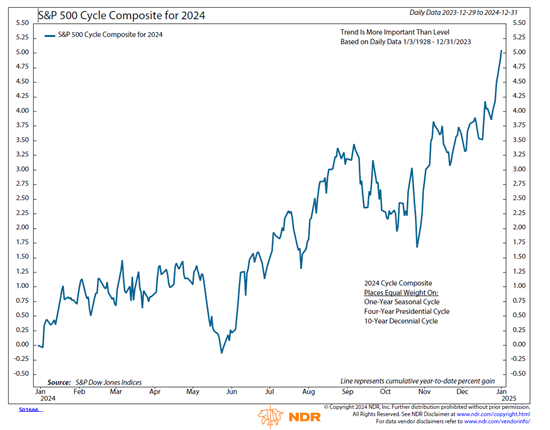
To review, the cycle composite is the brainchild of Ned Davis Research Group. In order to produce the composite, the analysts at NDR load all 1-year seasonal, 4-year Presidential, and 10-year Decennial cycles into the computer. They then create a mashup of the three to come up with a projection for what the coming year might look like. Below is the cycle composite's "roadmap" for 2024.
* Source: Ned Davis Research
As you can see, the first four months of the year look to be a bit choppy, but with an upward bias. As such, the old adage, "do nothing, absolutely nothing, until there is something to do" might be words to live by.
Well until the "Sell in May" period comes around, anyway. The cycles suggest that stock indices will then encounter some selling during the month of May before embarking on a strong "summer rally." Thus, one might want to ignore the latter half of the "sell in May and go away" rule this year.
After that, the cycles suggest the traditional "fall swoon" followed by a post-election rally into year-end. All in all, not a bad picture.
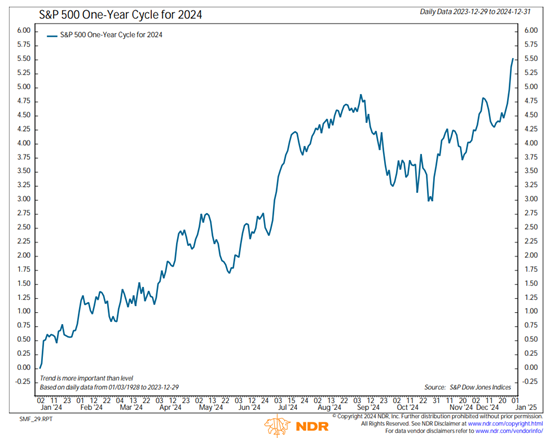
However, the components of the cycle composite paint slightly different pictures. For starters, look at the mashup of all 1-year seasonal cycles for 2024 below.
The 1-Year Cycle for 2024
* Source: Ned Davis Research
The 1-year cycles are definitely a bit more positive as a long-and-strong approach looks to be the way to play the first 8 months of the year. Then, of course, we could see the typical fall weakness and the usual run into year end. Personally, I'd vote for this chart as my preferred outcome!
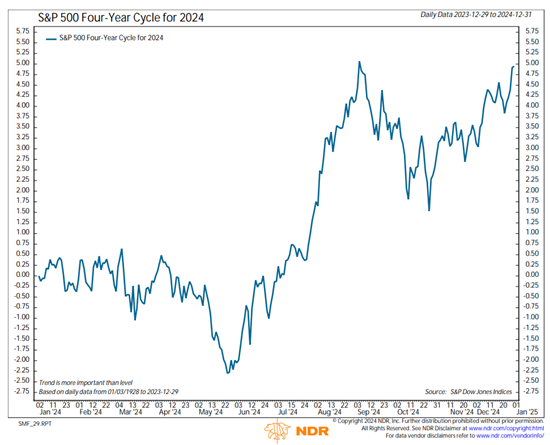
However, the Presidential cycles project a very different first half. In fact, these cycles suggest investors face a frustrating six months and won't show a gain on the year until well into July. Ugh.
The 4-Year Presidential Cycle for 2024
* Source: Ned Davis Research
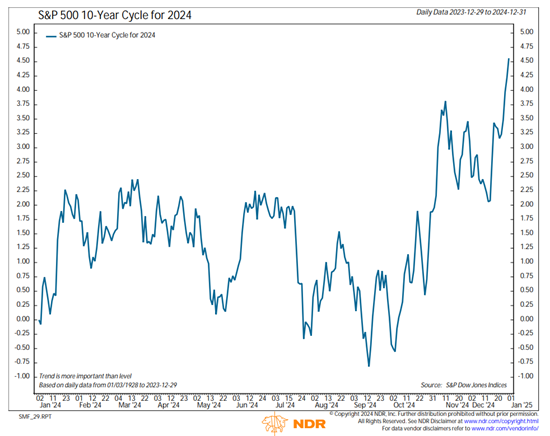
And finally, the roadmap for the 10-year decennial cycle doesn't look like any fun at all. Well, until after the election, that is.
The 10-Year Decennial Cycle for 2024
* Source: Ned Davis Research
I've found that the Cycle Composite tends to be the best of these mashups to pay attention to. And as I've opined a time or twenty, when the market is in sync with the cycle composite, the projection can be scary good. But then again, the market will often latch onto a specific driver and go its own way for a spell.
So far, the S&P 500 is ahead of the composite and looking a bit more like the 1-year cycle's trend. But, if the bears can find a raison d'etre in here somewhere, the rest of the cycle mashups suggest some choppy action wouldn't be surprising.
Thought for the Day:
There is no better way to clarify one's thinking than to try and explain it to someone else. -Margaret Thatcher
Wishing you green screens and all the best for a great day,

David D. Moenning
Founder, Chief Investment Officer
Heritage Capital Research, a Registered Investment Advisor

Disclosures
At the time of publication, Mr. Moenning held long positions in the following securities mentioned: None - Note that positions may change at any time.
NOT INDIVIDUAL INVESTMENT ADVICE. IMPORTANT FURTHER DISCLOSURES