The Jitters Are Justified

The State of the Market: Executive Summary
Another Monday. Another 1% move. I guess that's just the way the game is being played right now. According to Barron's, the S&P 500 has moved at least 1% in either direction every Monday since the end of August. Good to start each week with a little volatility, right?
You really can't blame traders for being at least a tad jittery on this particular Monday as there is a boatload of inputs coming this week. Unless you've been living in a cave, you already know that the biggest, baddest event of the week is tomorrow's election. In short, my take is markets won't be happy with a delayed (say, past Friday) or a contested result. Fingers crossed that everything goes smoothly.
You also are likely aware of the fact that cases of coronavirus are spiking uncontrollably around the globe. And shutdowns are starting to occur again. This has caused at least one major media outlet (the WSJ) to start asking questions about the outlook for the economy. For some time now, this has been a nagging worry in the back of my mind. Yes, we got the V-rebound. But where to from here?
In an article titled, "America's Economy Faces a Winter Chill," WSJ writer Justin Lahart makes the case that rising cases, cold weather, and dwindling resources could make the next few months tough. "The growing danger...is that the country is facing a set of challenges that could set it back on its heels." So, for investors, the state of the economy remains something to pay close attention to.
And then there's the earnings parade. Brace yourself, because more than 25% of S&P 500 constituents (130 to be exact) report earnings this week. Sure, companies have been "beating expectations" regularly. However, the "beats" don't seem to be getting rewarded much these days. It looks like many companies have been either "pulling forward" future demand (see the reports stating as much from NFLX and FB), or aren't saying much of anything (AAPL) - or anything good about the future (MSFT, AMZN). Thus, the next quarter or two could be interesting, to say the least.
Oh, and just to keep things interesting, remember that the Fed meets again this week. I'd expect for Mr. Powell to continue to be uber-dovish in his comments, which could help traders remember that there is a ginormous positive out there (As in the dueling stimuli from Congress and the Fed) that could easily help put a floor underneath stock prices at some point.
So, while I can certainly see how the current sloppy phase in stock prices could continue for a while - especially this week - I also believe there is a limit to how much downside damage can occur given that more free or almost-free money is likely to flow at some point in the future.
The Big-Picture Market Models
There are no changes to report on the Primary Cycle board again this week. As I've said a time or two recently, I believe the board supports the idea that stocks remain in a cyclical bull market and that we are currently seeing a correction of sorts. To me, this suggests that investors with a longer-term time horizon should continue to "buy the dips."
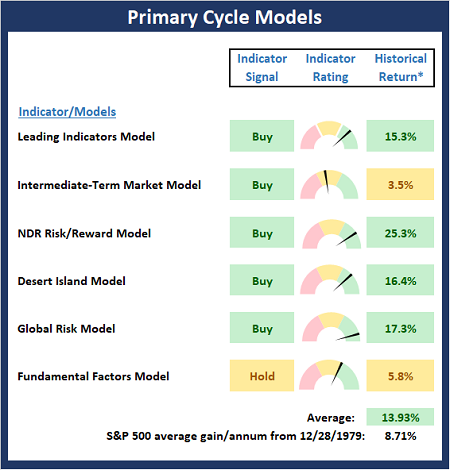
* Source: Ned Davis Research (NDR) as of the date of publication. Historical returns are hypothetical average annual performances calculated by NDR. Past performances do not guarantee future results or profitability - NOT INDIVIDUAL INVESTMENT ADVICE.
Checking On The "Primary" Cycles
While I don't often make portfolio adjustments based on the long-term trends in the stock market (aka the "primary cycles"), I have found over the years that checking in on state of the cycles and the weekly/monthly charts helps to keep the big-picture in perspective.
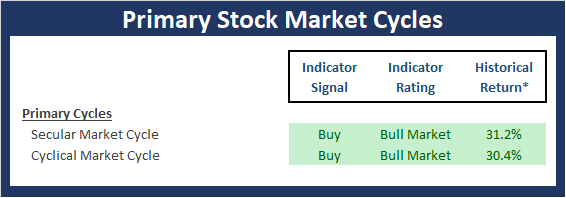
* Source: Ned Davis Research (NDR) as of the date of publication. Historical returns are hypothetical average annual performances calculated by NDR. Past performances do not guarantee future results or profitability - NOT INDIVIDUAL INVESTMENT ADVICE.
The Secular Market Cycle
Definition: A secular bull market is a period in which stock prices rise at an above-average rate for an extended period (think 5 years or longer) and suffer only relatively short intervening declines. A secular bear market is an extended period of flat or declining stock prices. Secular bull or bear markets typically consist of multiple cyclical bull and bear markets. Below is a monthly chart of the S&P 500 Index illustrating the current cycle, which we estimate began on March 9, 2009.
S&P 500 - Monthly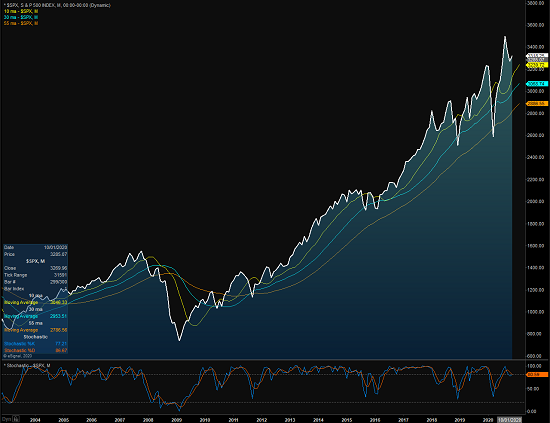
View Larger Chart Online
The Cyclical Market Cycle
Definition: A cyclical bull market requires a 30% rise in the DJIA after 50 calendar days or a 13% rise after 155 calendar days. Reversals of 30% in the Value Line Geometric Index since 1965 also qualify. A cyclical bear market requires a 30% drop in the DJIA after 50 calendar days or a 13% decline after 145 calendar days. Reversals of 30% in the Value Line Geometric Index also qualify. Below is a weekly chart of the S&P 500 illustrating the current cycle, which we estimate began on March 24, 2020.
S&P 500 - Weekly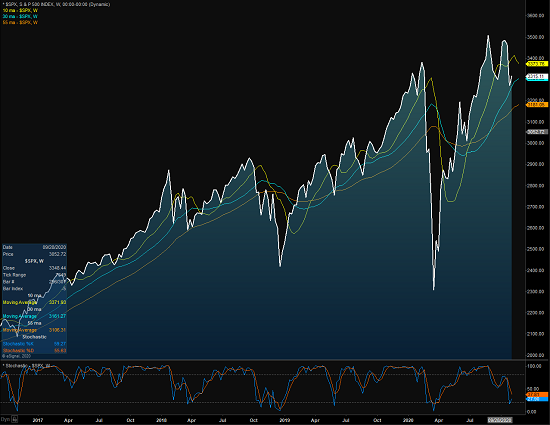
View Larger Chart Online
Thought For The Day:
The eye sees only what the mind is prepared to comprehend. -Henri Bergson
Wishing you green screens and all the best for a great day,

David D. Moenning
Founder, Chief Investment Officer
Heritage Capital Research, an SEC Registered Investment Advisor

Disclosures
At the time of publication, Mr. Moenning held long positions in the following securities mentioned: NFLX, FB, MSFT, AMZN, AAPL - Note that positions may change at any time.
NOT INVESTMENT ADVICE. DISCLAIMERS