The Key Questions

With the stock market putting up gains for a second consecutive month, the question of the day is if the recent rebound represents the beginning of a new cyclical bull market - or- simply another in a series of oversold bounces during the time of year when stocks typically move higher.
Although there are always two sides to this type of argument and there is really no way to know the answer without a healthy dose of hindsight, I thought I'd spend my pixels on this fine Monday morning examining where things stand and what the key questions the bulls might need answers to in order to believe the current joyride to the upside has some staying power.
But before we get to the key questions, I believe it is important to emphasize that while the price action has definitely improved since October 12th and even some of our momentum buy signals have been triggered, the bears remain in control of the game from an intermediate- and long-term perspective.
Exhibit A here is a weekly closing chart of the S&P 500. While this is an exceptionally simplistic approach to the subject and yes, we could certainly spend some time quibbling over the exact positioning of the trend line I've drawn onto the chart (in yellow), the point is that stocks remain in a downtrend from a longer-term perspective.
S&P 500 - Weekly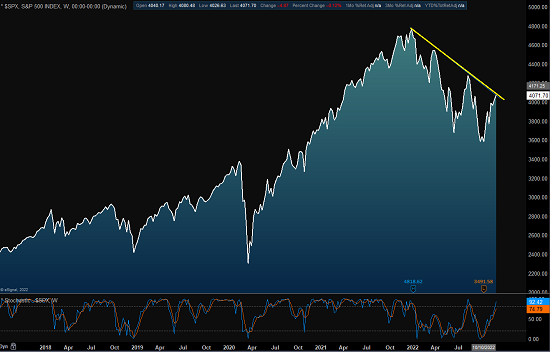
View Larger Chart
And although I am indeed a card-carrying member of the glass-is-at-least-half-full club, until this downtrend can be broken in a meaningful fashion (as in a "higher high" above 4280), I think we have to give the bears the benefit of the doubt. As such, I am not - absolutely NOT - suggesting that the bulls should expect nothing but blue skies ahead.
Let's also remember that impressive rallies are completely normal in this type of bear environment - and that we've already seen a couple other rebound attempts this year. As such, some skepticism towards the recent advance is natural. And as Canaccord Genuity's Tony Dwyer (who is one of the few analysts in my "circle of trust") reminds us, the average bear market bounce at this time of year tends to be around 12%. So, given that the S&P 500 rally from the October 12th low through Wednesday's close has totaled 14.06%, one can't be blamed for wondering if the bulk of the traditional year-end rally has already occurred.
So... Which is it? A new bull cycle or just another oversold bounce? While I'd love to tell you with the absolute certainty projected by so many market prognosticators (especially those seen on the financial networks), the truth of the matter is I just don't know. And in reality, I can argue both sides here with equal fervent, which is probably an exercise for another day.
But, as we embark on the final few weeks of trading for the year, I think it is important to understand the key questions that market participants are struggling with at the present time.
Cutting to the chase, I believe the most important question of the day is, what amount of damage will the Fed's inflation fight inflict on the economy (and, in turn earnings)?
The bears argue that the Fed will "overdo it" with their rate hike campaign and wind up pushing the economy into a "real" recession. You know, the type of economic environment where real pain is felt by real people, in a real way.
If this scenario plays out, the bottom line is earnings estimates remain too high. As do valuations. And as a result, stock prices will need to be "adjusted" to reflect the economic slowdown. Which, of course, our furry friends in the bear camp argue means lower lows ahead.
However, the players on the opposite sideline contend that the economy can "handle" the higher rates (for now) and that if the Fed can "pivot" from its aggressive stance within a reasonable timeframe, everything will be fine.
The bulls argue that Friday's Jobs report supports this type of "soft landing" scenario, where the economy slows but not meaningfully so. And since there are indeed signs that inflation is (finally) starting to show signs of slowing, our heroes in horns contend that the point where Jay Powell & Co. can back off is on the horizon.
While I can appreciate the points from both teams, I believe the most important issue here is one of timing. I.E. Can inflation pull back far enough, soon enough, for the Fed to pivot and avoid wrecking the economy?
Time will tell, of course. So, for now, the markets will be wrestling with the issues of timing (as in, when will inflation really start to fall and when will the Fed pivot) and economic damage. And from my seat, this "argument" will continue to play out in the markets on a daily basis - likely for some time to come.
In the end, THIS is what a "bottoming process" is all about. This is what a "basing phase" looks and feels like. One minute the markets are hopeful, and the next, well, not so much.
So, my thought at this stage of the game is to remain optimistic about the prospects of a soft landing but keep those capital preservation tools handy, just in case.
Now let's review the "state of the market" through the lens of our market models...
The Big-Picture Market Models
We start with six of our favorite long-term market models. These models are designed to help determine the "state" of the overall market.
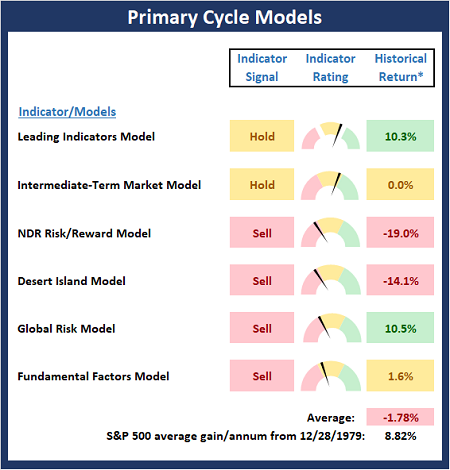
* Source: Ned Davis Research (NDR) as of the date of publication. Historical returns are hypothetical average annual performances calculated by NDR.
The Fundamental Backdrop
Next, we review the market's fundamental factors including interest rates, the economy, earnings, inflation, and valuations.
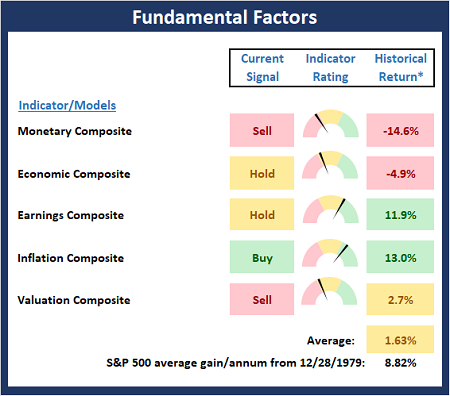
* Source: Ned Davis Research (NDR) as of the date of publication. Historical returns are hypothetical average annual performances calculated by NDR.
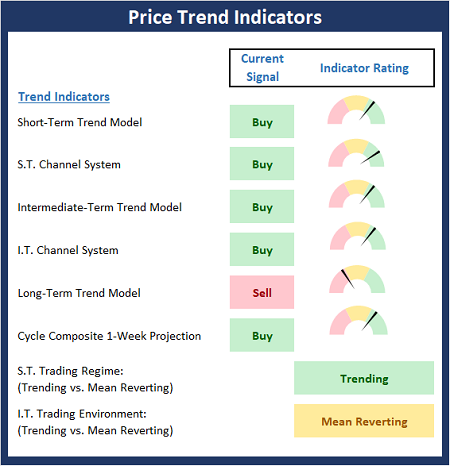
The State of the Trend
After reviewing the big-picture models and the fundamental backdrop, I like to look at the state of the current trend. This board of indicators is designed to tell us about the overall technical health of the market's trend.
The State of Internal Momentum
Next, we analyze the momentum indicators/models to determine if there is any "oomph" behind the current move.

* Source: Ned Davis Research (NDR) as of the date of publication. Historical returns are hypothetical average annual performances calculated by NDR.
Early Warning Indicators
Finally, we look at our early warning indicators to gauge the potential for countertrend moves. This batch of indicators is designed to suggest when the table is set for the trend to "go the other way."
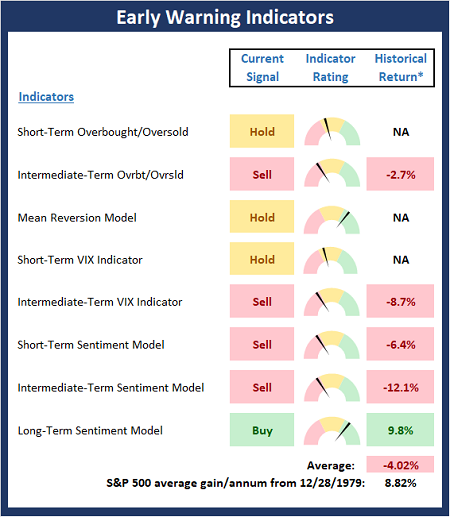
* Source: Ned Davis Research (NDR) as of the date of publication. Historical returns are hypothetical average annual performances calculated by NDR.
Thought for the Day:
I love deadlines. I especially like the whooshing sound they make when they fly by. -Douglas Adams
Wishing you green screens and all the best for a great day,

David D. Moenning
Founder, Chief Investment Officer
Heritage Capital Research, a Registered Investment Advisor

Disclosures
At the time of publication, Mr. Moenning held long positions in the following securities mentioned: None - Note that positions may change at any time.
NOT INDIVIDUAL INVESTMENT ADVICE. IMPORTANT FURTHER DISCLOSURES