The Lines In The Sand Are Clear
Executive Summary:
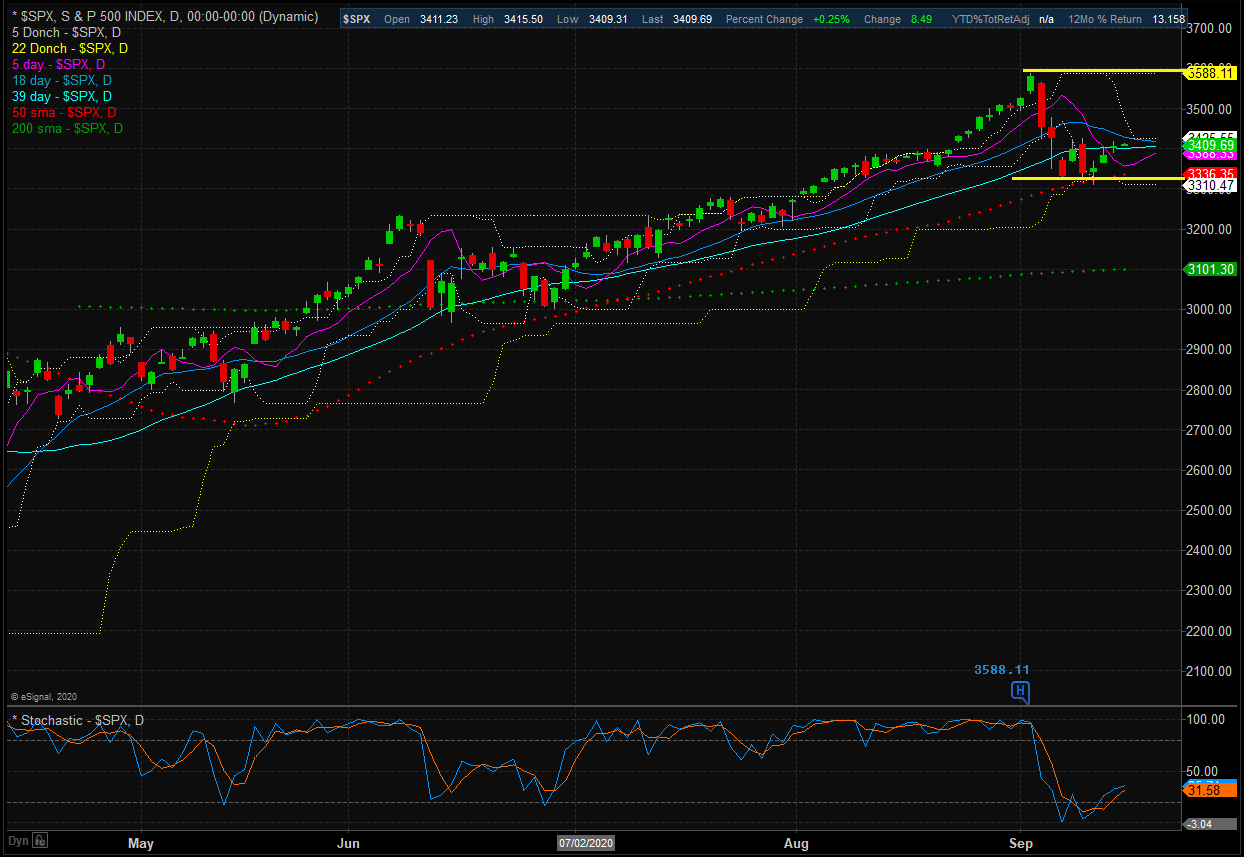
The good news is the bulls have been able to hold the line at key support levels (think 50-day moving averages) across the board on the major stock market indices. The bad news is the recent rebound hasn't reversed the trend or moved the bulls completely out of harm's way. As such, my take is that the battle lines have been drawn for the two teams to fight over in the weeks ahead. The bottom line is the bulls need a breakout above the 3589 level on a closing basis on the S&P 500 cash index while the bears are hoping for a break down below 3310. And everything in between can be viewed as basically "noise."
The State of the Trend Indicators
While still far from positive, the Trend Board has definitely perked up a bit over the past week. Neutral "hold" signals have replaced the "sells" from a week ago in both the Short-Term Trend and Channel Systems. And while the Intermediate-Term Channel System ticked down to neutral from positive, the board now sports a largely neutral position. From my seat, this means you can hold current long positions until/unless the bears can produce (and hold) a meaningful break below the recent lows.
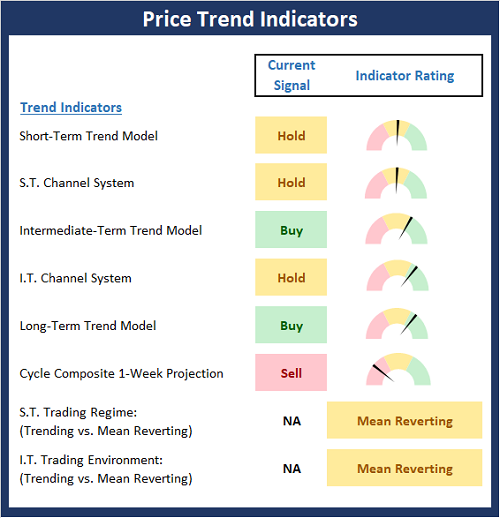
View Trend Indicator Board Online
NOT INDIVIDUAL INVESTMENT ADVICE.
About The Trend Board Indicators: The models/indicators on the Trend Board are designed to determine the overall technical health of the current stock market trend in terms of the short- and intermediate-term time frames.
My Take on the State of the Charts...
The "test" of the recent support zones has been successful so far. However, the bulls will want to put some distance between here and the lows (and avoid additional downside testing) as the old saw says that the more a zone is tested, the weaker it becomes. So, if the bulls can continue movin' on up and make an effort to start testing the upper lines in the sand (i.e. key resistance), we'd consider that bullish action. However, if the current rebound begins to stall, then we should probably expect some additional downside price exploration. Oh, and plenty of volatile back-and-forth action in between - that's just how the game is played these days.
S&P 500 - Daily
View Larger Chart
One of the complaints in the market has been the concentration in the megacap leaders. I think it is important to note that (a) this type of condition is fairly typical at times (especially in a global pandemic that is producing clear winners that are growing and gaining market share) and (b) that this can last for some time. However, in looking at the "total market" index (Vanguard's Total Stock Market Index ETF - VTI) one can argue the broad market is "doing just fine, thank you." Yes, VTI is cap-weighted so it winds up being drawn toward the large-cap blend quadrant of the style boxes. And yes, VTI does hold a healthy chunk of the FANG's - albeit in smaller doses than the SPY and/or QQQ. But from my seat, the fact that the this "core" ETF remains in an uptrend suggests that the bulls are still in control of the game from a big-picture standpoint.
Vanguard Total Stock Market - Daily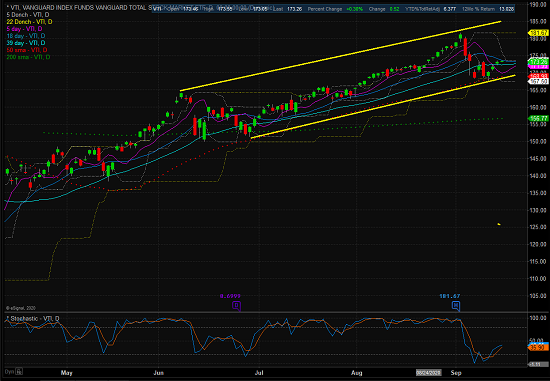
View Larger Chart Online
Next, let's check in on the state of the market's internal momentum indicators.
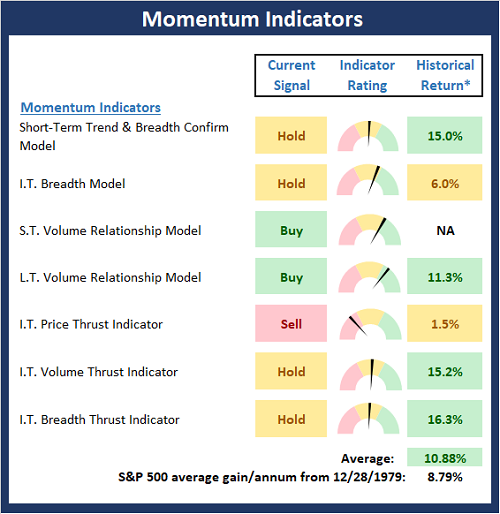
View Momentum Indicator Board Online
* Source: Ned Davis Research (NDR) as of the date of publication. Historical returns are hypothetical average annual performances calculated by NDR. Past performances do not guarantee future results or profitability - NOT INDIVIDUAL INVESTMENT ADVICE.
I've always believed that momentum is "where the rubber meets the road" in terms of the true state of the market. Thus, it is modestly positive that the Momentum Board has replaced a couple sell signals with hold signals this week. And while the board looks to be neutral overall, the hypothetical historical return of the S&P 500 with the momentum models in their current state has moved up from 1.36% per annum last week to 10.88% this week. In my book, this is a meaningful improvement and suggests that we continue to give the bulls the benefit of any doubt here.
So, given that the S&P has already experienced what amounts to a "garden variety" correction (a pullback in the -5% to -10% range, this one has been about -7% so far), it might be best to remain optimistic unless/until the bears can produce a break below those lines in the sand.
My view is that if the bears can find a reason to break through to the downside, we could easily see some additional scary downside action, which would likely be one-directional and violent. But until then, I think it is best to look on the bright side and give the bulls a chance.
Thought For The Day:
Banking institutions are more dangerous to our liberties than standing armies. -Thomas Jefferson (1802)
Wishing you green screens and all the best for a great day,

David D. Moenning
Founder, Chief Investment Officer
Heritage Capital Research

Disclosures
At the time of publication, Mr. Moenning held long positions in the following securities mentioned: SPY, QQQ, VTI - Note that positions may change at any time.
Trend Models Explained
Short-Term Trend Model: A series of indicator designed to identify the status of the stock market’s short-term (0-3 weeks) trend. The model compares the current price of S&P 500 relative to 5-day customized smoothing (weighted and moved forward 3 periods), the relationship of the 5-day to the 10-day, and the relationship of 10-day to 39-day.
Short- and Intermediate-Term Channel Breakout Systems: The short-term and intermediate-term Channel Breakout Systems are modified versions of the Donchian Channel indicator. According to Wikipedia, "The Donchian channel is an indicator used in market trading developed by Richard Donchian. It is formed by taking the highest high and the lowest low of the last n periods. The area between the high and the low is the channel for the period chosen."
Intermediate-Term Trend Model: A model designed to identify the status of the stock market’s intermediate-term (3 weeks to 6 months) price trend. The model compares the current weekly price of S&P 500 relative to relative to customized 10-week smoothing (weighted and moved forward 3 periods), the relationship of the 10-week to the 30-week, and the relationship of 30-week to 55-week.
Long-Term Trend Model: An indicator designed to identify the status of the stock market’s longer-term (>6 months) trend. The indicator compares the 50-day smoothing of the S&P 500 relative to its 200-day smoothing. When the 50-day is above 200-day, the indicator is positive and vice versa.
Cycle Composite Projections: The cycle composite combines the 1-year Seasonal, 4-year Presidential, and 10-year Decennial cycles. The indicator reading shown uses the cycle projection for the upcoming week.
Short- and Intermediate-Term Trading Mode Models: These indicators attempt to identify whether the current market action represents a "trending" or "mean reverting" environment. The indicator utilizes the readings of the Efficiency Ratio, the Average Correlation Coefficient, and Trend Strength models.
Momentum Models Explained
Short-Term Trend-and-Breadth Model: History shows the most reliable market moves tend to occur when the breadth indices are in tune with the major market averages. When the breadth measures diverge, investors should take note that a trend reversal may be at hand. This indicator incorporates an All-Cap Dollar Weighted Equity Series and A/D Line. At the time of this writing, when the A/D line has been above its 5-day smoothing and the All-Cap Equal Weighted Equity Series is above its 25-day smoothing, the equity index has gained at a rate of +26.5% per year since 1980. When one of the indicators is above its smoothing, the equity index has gained at a rate of +14.5% per year. And when both are below, the equity index has lost over -20% per year.
Intermediate-Term Breadth Model: A proprietary diffusion index developed by Ned Davis Research. The indicator is designed to determine the technical health of the market’s 157 sub-industry groups (GICS categorizes the market into 11 sectors, 20 industries, and 157 sub-industry groups). Technical health is determined by the direction of each sub-industry’s long-term smoothing and the rate of change of the sub-industry’s price index.
Short- and Long-Term Volume Relationship Models: These models review the relationship between "supply" and "demand" volume over the short- and intermediate-term time frames.
Intermediate-Term Price Thrust Model: This indicator measures the 3-day rate of change of the Value Line Composite relative to the standard deviation of the 30-day average.
Intermediate-Term Volume Thrust Model: This indicator uses NASDAQ volume data to indicate bullish and bearish conditions for the NASDAQ Composite Index. The indicator plots the ratio of the 10-day total of NASDAQ daily advancing volume to the 10-day total of daily declining volume. The indicator supports the case that a rising market supported by heavier volume in the advancing issues tends to be the most bullish condition, while a declining market with downside volume dominating confirms bearish conditions.
Breadth Thrust Model: This indicator uses the number of NASDAQ-listed stocks advancing and declining to indicate bullish or bearish breadth conditions for the NASDAQ Composite. The indicator plots the ratio of the 10-day total of the number of stocks rising on the NASDAQ each day to the 10-day total of the number of stocks declining each day. Using 10-day totals smooths the random daily fluctuations and gives indications on an intermediate-term basis. Historically, the NASDAQ Composite has performed much better when the 10-day A/D ratio is high (strong breadth) and worse when the indicator is in its lower mode (weak breadth). The most bullish conditions for the NASDAQ when the 10-day A/D indicator is not only high, but has recently posted an extreme high reading and thus indicated a thrust of upside momentum. Bearish conditions are confirmed when the indicator is low and has recently signaled a downside breadth thrust.
NOT INVESTMENT ADVICE. The opinions and forecasts expressed herein are those of Mr. David Moenning and Heritage Capital Research and may not actually come to pass. The opinions and viewpoints regarding the future of the markets should not be construed as recommendations. The analysis and information in this report is for informational purposes only. No part of the material presented in this report is intended as an investment recommendation or investment advice. Neither the information nor any opinion expressed constitutes a solicitation to purchase or sell securities or any investment program.
Any investment decisions must in all cases be made by the reader or by his or her investment adviser. Do NOT ever purchase any security without doing sufficient research. There is no guarantee that the investment objectives outlined will actually come to pass. All opinions expressed herein are subject to change without notice. Neither the editor, employees, nor any of their affiliates shall have any liability for any loss sustained by anyone who has relied on the information provided.
Mr. Moenning of Heritage Capital Research is an investment adviser representative of Eastsound Capital Advisors, LLC, a registered investment advisor. The adviser may not transact business in states where it is not appropriately registered, excluded or exempted from registration. Individualized responses to persons that involve either the effecting of transaction in securities, or the rendering of personalized investment advice for compensation, will not be made without registration or exemption.
Mr. Moenning and Heritage Capital Research may at times have positions in the securities referred to and may make purchases or sales of these securities while publications are in circulation. Positions may change at any time.
The analysis provided is based on both technical and fundamental research and is provided "as is" without warranty of any kind, either expressed or implied. Although the information contained is derived from sources which are believed to be reliable, they cannot be guaranteed.
The author neither endorses nor warrants the content of this site, any embedded advertisement, or any linked resource. The author or his managed funds may hold either long or short positions in the referenced securities. Republication rights must be expressly granted by author in writing.
Investments in equities carry an inherent element of risk including the potential for significant loss of principal. Past performance is not an indication of future results.