The Market's Dilemma
The State of the Market
Another Monday. Another positive vaccine headline... This is a trend that investors could get used to!
For the third straight week, investors woke up Monday morning to encouraging news. This week, it's the Brits (the Oxford-AstraZeneca partnership) coming through with a highly effective vaccine. Although these results were a little different due to the fact that one approach used (taking a half dose first and a full dose a month later) was more effective than the other (two full doses a month apart), it is still a third vaccine that looks to be able to protect people from this virus. Good news, indeed.
The bad news is this appears to be a "hurry up and wait" situation for both the global economies and anyone anxious to get their lives back to "normal."
Unfortunately, everyone is going to have get through what is expected to be a grim winter with cases, hospitalizations, and deaths currently rising at a parabolic rate. And with more than a million folks hopping on airplanes on Friday alone (which was the largest single day passenger total since the pandemic began), there are very serious concerns that this week's Thanksgiving holiday becoming a mega-spreader event. As such, some argue the worst of the pandemic may still be ahead of us.
With the knowledge that help is on the way in a matter of months, the other problem is that a fair amount of economic activity will likely be put on hold for a while. After all, lockdowns are happening again and are likely to continue to increase. I got a blaring alert on my iPhone yesterday morning, informing me that my region "is at severe risk from deadly COVID." So, like most folks, my wife and I have decided that since waiting a few months to travel anywhere will make life much safer - why not just hunker down and wait for the vaccine?
This thinking has caused some to reset their outlooks for the economy. Both JPMorgan (JPM) and Moody's Analytics are already out with calls for GDP to shrink in the first and second quarters of next year. And this means a "double dip" recession is clearly on the table.
But before you run out and load up on those inverse index ETF's, let's keep in mind that current estimates suggest the vaccines could be widely distributed by mid-May of next year. And let's also remember that this good news clearly falls within the time frame the market tends to look forward to.
Another positive is the idea that once the vaccine arrives, folks will likely have pent up spending plans. Then if you throw in some additional government stimulus (assuming lawmakers ever get around to it), well, the anticipated rebound could be impressive.
So... It appears that investors and the market face a dilemma. Do you look ahead to better days or focus on hideous impact the virus is likely to have in the coming months? Time to place your bets.
My guess is that stocks will continue to look ahead. However, the road from here to there is likely to be long and bumpy. As such, keeping a little powder dry so that you can put it to work when things get nasty probably isn't a bad idea. That's my plan, and for now, I'm sticking to it.
Now let's turn to the state of my favorite big-picture market models...
The Big-Picture Market Models
Once again, there are no changes to report on the Primary Cycle board this week. As I've been saying recently, the message from the board suggests the bulls should be given the benefit of any/all doubt. So, with stocks still in a cyclical bull market, I believe investors with a longer-term time horizon should continue to ride the bull train and be prepared to "buy the dips" whenever bad news comes along.
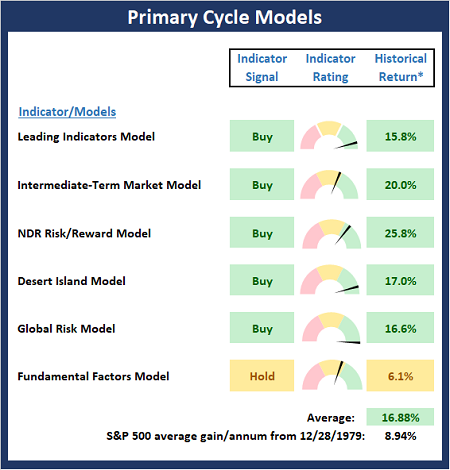
* Source: Ned Davis Research (NDR) as of the date of publication. Historical returns are hypothetical average annual performances calculated by NDR.
Checking On The "Primary" Cycles
While I don't often make portfolio adjustments based on the long-term trends in the stock market (aka the "primary cycles"), I have found over the years that checking in on state of the cycles and the weekly/monthly charts helps to keep the big-picture in perspective.
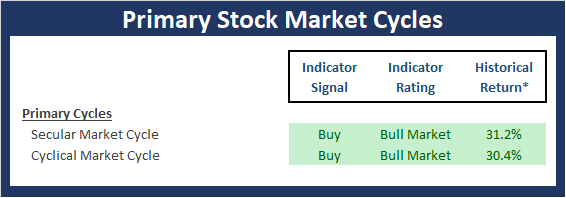
* Source: Ned Davis Research (NDR) as of the date of publication. Historical returns are hypothetical average annual performances calculated by NDR.
The Secular Market Cycle
Definition: A secular bull market is a period in which stock prices rise at an above-average rate for an extended period (think 5 years or longer) and suffer only relatively short intervening declines. A secular bear market is an extended period of flat or declining stock prices. Secular bull or bear markets typically consist of multiple cyclical bull and bear markets. Below is a monthly chart of the S&P 500 Index illustrating the current cycle, which we estimate began on March 9, 2009.
S&P 500 - Monthly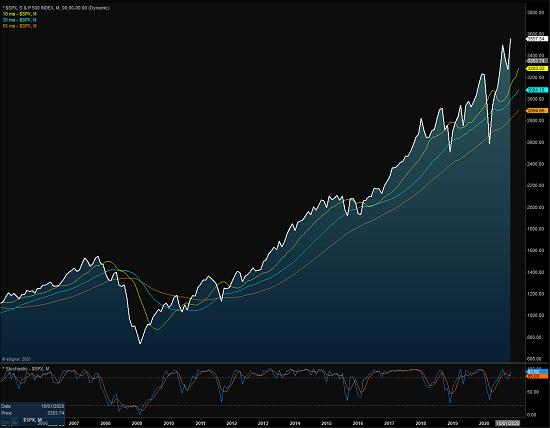
View Full Size Chart Online
The Cyclical Market Cycle
Definition: A cyclical bull market requires a 30% rise in the DJIA after 50 calendar days or a 13% rise after 155 calendar days. Reversals of 30% in the Value Line Geometric Index since 1965 also qualify. A cyclical bear market requires a 30% drop in the DJIA after 50 calendar days or a 13% decline after 145 calendar days. Reversals of 30% in the Value Line Geometric Index also qualify. Below is a weekly chart of the S&P 500 illustrating the current cycle, which we estimate began on March 24, 2020.
S&P 500 - Weekly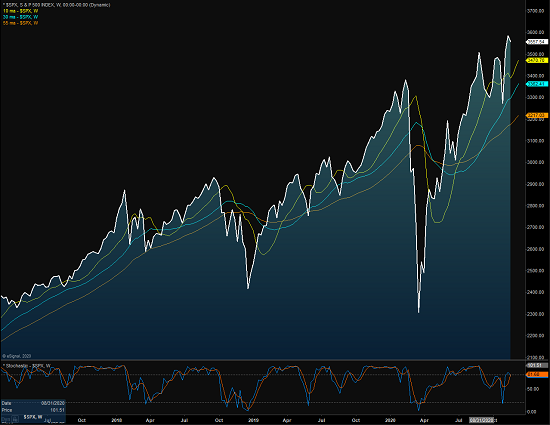
View Full Size Chart Online
Thought For The Day:
"Success consists of going from failure to failure without loss of enthusiasm." -Winston Churchill
Wishing you green screens and all the best for a great day,

David D. Moenning
Founder, Chief Investment Officer
Heritage Capital Research, an SEC Registered Investment Advisor
Disclosures
At the time of publication, Mr. Moenning held long positions in the following securities mentioned: none - Note that positions may change at any time.
NOT INDIVIDUAL INVESTMENT ADVICE. IMPORTANT FURTHER DISCLOSURES

