The Most Important Chart of the Year

As a new year gets underway, it is always important to be on the lookout for changes in the markets. Examples here include changes to leadership, trend, investor sentiment, momentum, and/or the macro-outlook. One of the important lessons I've learned is that changes can happen fast - especially as the calendar resets.
So far at least, the market action has clearly improved in 2023. The trend is up. Momentum indicators are turning positive. And leadership is on the move. All of which can be placed on the "good" side of the market analysis ledger.
But (you knew that was coming, right?), our furry friends in the bear camp are quick to point out that despite the improved tenor, the S&P 500 has only made it back to its downwardly trending 200-day moving average. And of course, the 200-day is viewed by many market participants as a line in the sand that determines which team has possession of the ball.
So, given that the venerable index has failed in its previous attempts to break on through to the other side, the-glass-is-at-least-half-empty crowd contends that things are unlikely to be different this time around.
To be sure, market technicians will agree that stocks remain in a downtrend and until a "higher high" can be established, traders are likely to continue to "fade" any/all rally attempts - especially once the indices reach those overbought levels or bump into any key technical areas.
An Important Change To Note
With that said, and while I can certainly appreciate the bear camp's argument, there is also an important change to take note of as we embark on our 2023 investing journey.
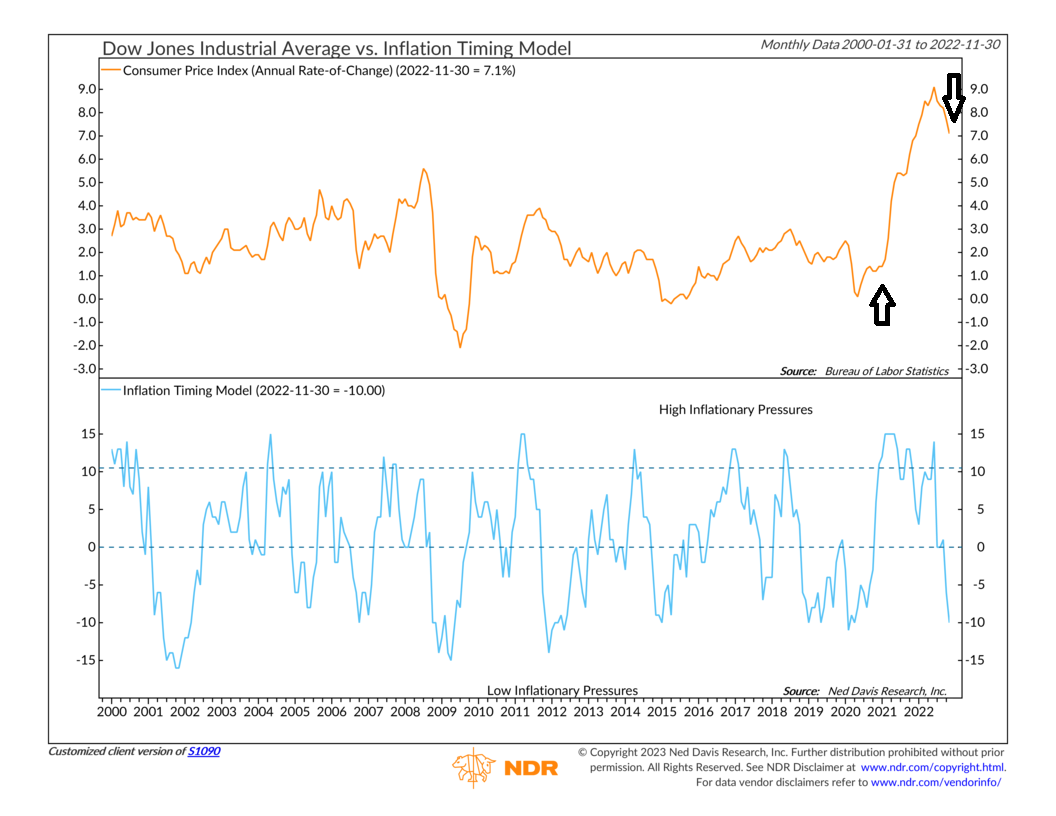
The chart below is NDR's Inflation Timing Model. This is a group of indicators designed to "call" the direction of inflation. And while it has been a very long time since such a model has been in play, inflation is clearly a focal point of this market. Thus, getting a feel for where inflation is likely headed from here could prove to be helpful.
Longtime readers know that this model did a superb job of alerting us to the big move up in inflation - and BEFORE everything from semiconductors, cars, houses and oil got more expensive. So, I thought it was a good idea to point out what the model is telling us about what to expect going forward.
Inflation Timing Model 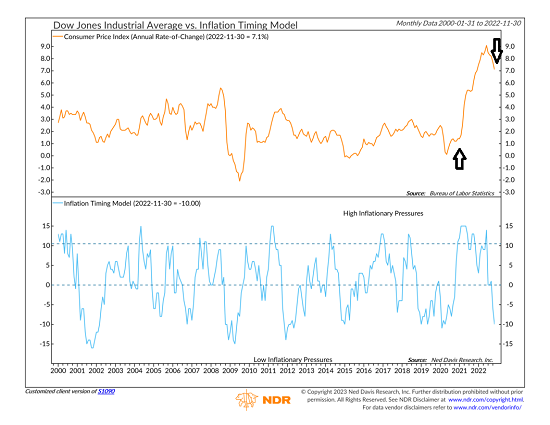
View Larger Chart
Image Source: Ned Davis Research Group
Cutting to the chase, the Inflation Timing Model is on a Sell signal and near one of the lowest levels seen in the last decade. This tells us that while inflation readings remain high (likely due in large part to the way the government accounts for changes in rents/shelter), the model is in the "Low Inflationary Pressures" mode. A mode where inflation has moved lower in the past.
So, from my seat, the idea that inflationary pressures are now in the "low" zone suggests that one of the market's major concerns/worries is likely to recede as we move forward in 2023.
This is not to say that it will be smooth sailing ahead for the bulls or that the road won't be bumpy along the way, as there are many inputs to the game. But with the inflation backdrop heading in the right direction, my thinking is we may want to start giving the bulls the benefit of the doubt - and perhaps even buying the dips again.
Now let's review the "state of the market" through the lens of our market models...
Primary Cycle Models
Below is a group of big-picture market models, each of which is designed to identify the primary trend of the overall "state of the stock market."
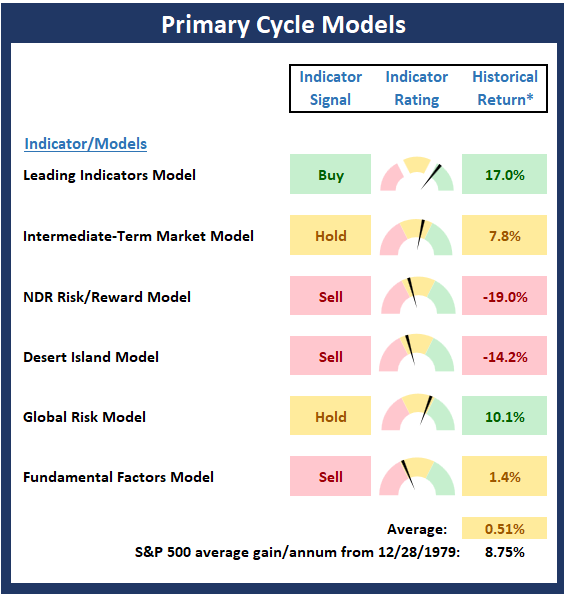
* Source: Ned Davis Research (NDR) as of the date of publication. Historical returns are hypothetical average annual performances calculated by NDR.
Trend Analysis:
Below are the ratings of key price trend indicators. This board of indicators is designed to tell us about the overall technical health of the market's trend.
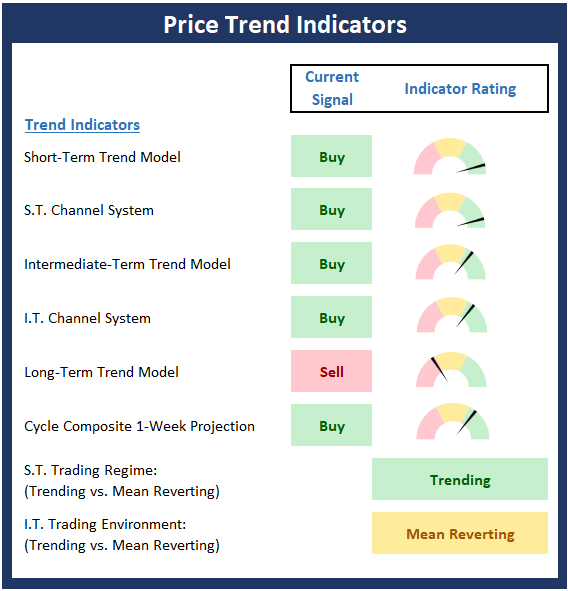
Key Price Levels
- S&P 500 Near-Term Support Zone: 3905
- S&P 500 Near-Term Resistance Zone: 4080
- S&P 500 50-day Simple MA: 3914
- MA Direction: Rising
- S&P 500 200-day Simple MA: 3981
- MA Direction: Declining
Market Momentum Indicators
Below is a summary of key internal momentum indicators, which help determine if there is any "oomph" behind a move in the market.
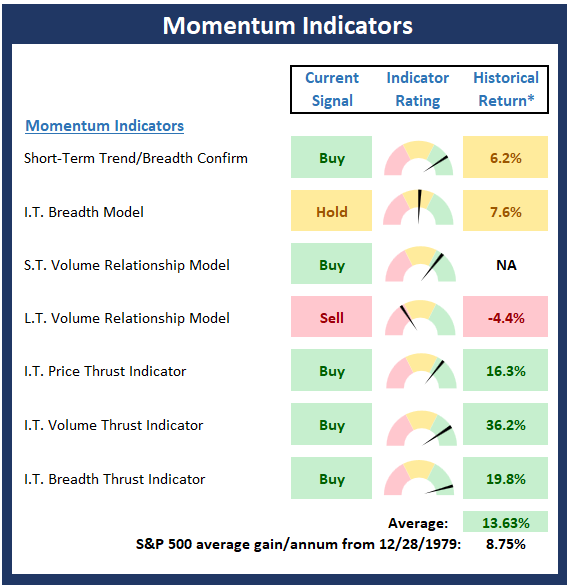
* Source: Ned Davis Research (NDR) as of the date of publication. Historical returns are hypothetical average annual performances calculated by NDR.
Early Warning Indicators
Below is a summary of key early warning indicators, which are designed to suggest when the market may be ripe for a reversal on a short-term basis.
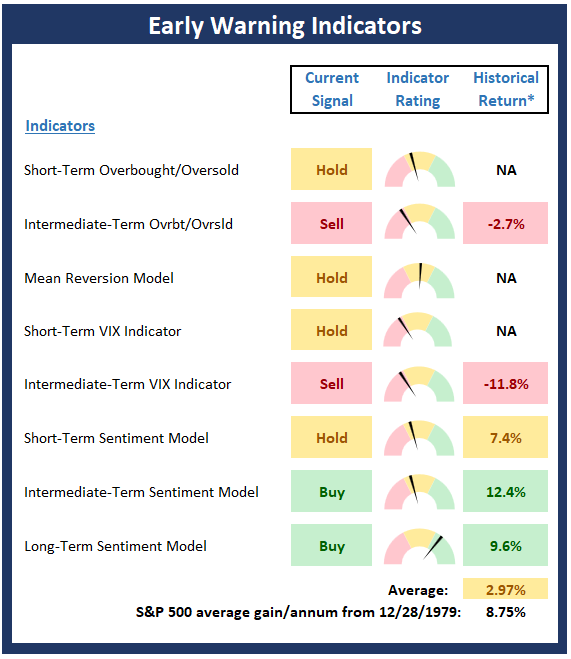
* Source: Ned Davis Research (NDR) as of the date of publication. Historical returns are hypothetical average annual performances calculated by NDR.
Fundamental Factor Indicators
Below is a summary of key external factors that have been known to drive stock prices on a long-term basis.
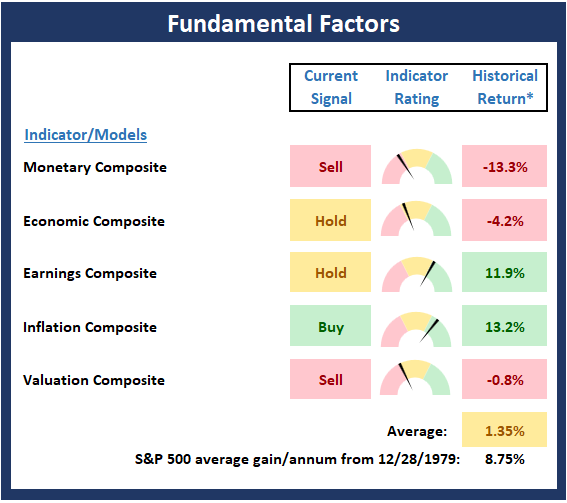
* Source: Ned Davis Research (NDR) as of the date of publication. Historical returns are hypothetical average annual performances calculated by NDR.
Thought for the Day:
The meaning of life is to give life a meaning. -- Unknown
Wishing you green screens and all the best for a great day,

David D. Moenning
Founder, Chief Investment Officer
Heritage Capital Research, a Registered Investment Advisor

Disclosures
At the time of publication, Mr. Moenning held long positions in the following securities mentioned: None - Note that positions may change at any time.
NOT INDIVIDUAL INVESTMENT ADVICE. IMPORTANT FURTHER DISCLOSURES