The Problem is Obvious, But...

By now, the problem is obvious. Higher inflation for longer than had been expected. Ditto for the Fed's rate hiking plans. The outlooks for both the economy and earnings are heading in the wrong direction - and fast. In response, so too is the appropriate multiple to apply to those declining earnings.
In short, the bears are back and the summer rally that offered up the hope that we had seen the worst has been erased. Completely.
The S&P 500 is down 23% on the year, the Dow is off 19.6%, and growth funds (using the Vanguard Growth ETF - symbol VUG - as a proxy) have given up 31.3%. P.S. Oh, and for those keeping score at home, the ARK Innovation ETF is down 70% from its high again, which requires a gain of about 230% from here to return to the glory days. Good times.
A Bounce in the Offing?
Our friends in the Bull camp are quick to point out that after last week's shellacking, stocks are once again very oversold (this time from all 3 major time-frame references), sentiment has reached extremely negative levels, babies are being thrown out with the bath water, and just about everybody on the planet can easily/quickly recite the bear argument. And with the general feeling that there is no hope on the horizon, our Heroes in Horns are quick to claim that a relief rally shouldn't be too far away.
While I certainly concur and will admit that Friday had a give-up/flush feel to it that seemed to smack of a liquidation event, my concern is that any relief bounce into the start of earnings season might be short-lived.
Relief Rallies Are Just That
As a reminder, I tend to side with the glass-is-at-least-half-full crowd when it comes to my outlook for markets. And please accept my apologies if it sounds like I'm channeling my inner negative Nancy this morning. But at this moment, I think it might be a bit premature to look ahead to better days.
As such, it is probably best to view any bounces in the near term as relief rallies in an ongoing bear cycle. Until something changes, that is.
It's All Fundamental
The problem is the drivers of this decline are fundamental in nature. Inflation. The economy. Interest Rates. And earnings. None of which are trending in the right direction at the present time. Ugh.
Let's start with inflation. Yes, it is absolutely true that markets DO look ahead, and I DO believe that inflation will begin to trend lower soon. The key question is if the shift in the inflation trend will happen soon enough - and go far enough - for (a) the Fed to pivot, (b) the economy to stay out of the ditch, and (c) the earnings picture to remain upbeat. In sum, the needle will have to be threaded almost perfectly for something not to break along the way here.
Turning to the economy, while the odds of recession were in the 25% range a few short months ago, those odds are now MUCH higher. For example, the current "bond king," aka Doubleline's Jeffrey Gundlach, who, for the record, has been bearish for quite some time, said the odds of the economy falling into recession in 2023 are now "very high," in the 75% range.
In addition, a little firm called Goldman Sachs (GS) said last week that the risks are skewed to the downside due to rising odds of recession. In response, the firm slashed their year-end target for the S&P to 3600, from 4300. Oh, and they also suggest that the multiple applied to next year's earnings needs to go from 18X to something on the order of 15X.
The math here is pretty straightforward. According to Ned Davis Research Group, the consensus estimates for S&P 500 earnings per share for 2023 currently stands at $240.36. Multiply that by 15 and you get 3605.40. Hence Goldman's 3600 call.
But here's the rub. Six month or so ago, the consensus EPS estimate for 2023 was above $250. This means that at 240.36, the estimates have come down - by about 4.2%. Compare this to the 7.6% decline the 2022 estimates have declined. Now factor in the growing feeling that the economy is likely heading into recession at some point in 2023 and it isn't much of a stretch for the bears to argue that earnings estimates are simply too high. And must come down.
The question, of course, is to what level?
A Little Thing Called Multiple Compression
Tony Dwyer of Cannacord Genuity, suggests that EPS for 2023 is more likely to be in the $220 zone than the current consensus estimate of $240. Now slap Goldman's 15 multiple on that and you get a target of 3300 for the S&P 500, which is more than 10% lower than Friday's close. Super.
This thinking is where a little something called "multiple compression" come from. Investors don't like what they see looking ahead - you know, inflation, the Fed's battle, recession, etc. - so they want lower prices before they start buying in earnest.
The Good News
Which brings us to the good news. According to Reuters, fund managers are sitting on the highest levels of cash in portfolios since... wait for it... 2001. So, cutting to the chase, this means that when presented with what would appear to be a "turn" in the environment - or - prices that present long-term values too good to pass up, cash is going to come off the sidelines and into the markets - both equity and bond markets.
And just like that, the next bull market will be born.
On that note, Gundlach also opined last week that the current "opportunity" in the bond market is the best he's seen in a decade. So, if investors can become convinced that the turn in inflation is actually on the horizon, I wouldn't be surprised to see the pro's putting money to work in the bond market in an effort to capture that opportunity.
It also follows that a weakening in the economic data would also send yields lower as growth expectations fall - especially on the longer end of the curve.
What to Watch For
My current thinking is that stocks may need some additional downside "price exploration" while the outlook for inflation, the economy, earnings, and the Fed's path becomes clearer. And while this is certainly just one man's opinion, my guess is that this process will play out via a traditional "bottoming process" which includes a series of rallies and declines - and will take time to work through.
It is worth noting that according to Tony Dwyer, stocks have never bottomed before the yield on the 2-year has topped out. So, if you are looking for a sign that it might be okay to start buying stocks again, a turn in the 2-year would be a good start.
While it may be counterintuitive, another sign that it might be time to start getting back into the pool would be a turn for the worse in the economic data. The thinking here is the faster the data declines (and unemployment rises), the faster the Fed can take their foot off the gas. And the moment the market realizes that the Fed is likely to reverse course will likely be the time that the next bull market is born.
Now let's review the "state of the market" through the lens of our market models...
The Big-Picture Market Models
We start with six of our favorite long-term market models. These models are designed to help determine the "state" of the overall market.
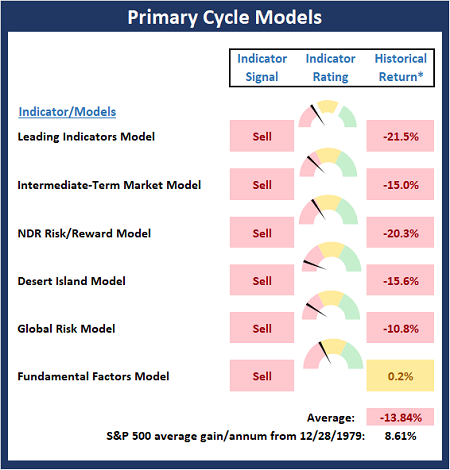
* Source: Ned Davis Research (NDR) as of the date of publication. Historical returns are hypothetical average annual performances calculated by NDR.
The Fundamental Backdrop
Next, we review the market's fundamental factors including interest rates, the economy, earnings, inflation, and valuations.
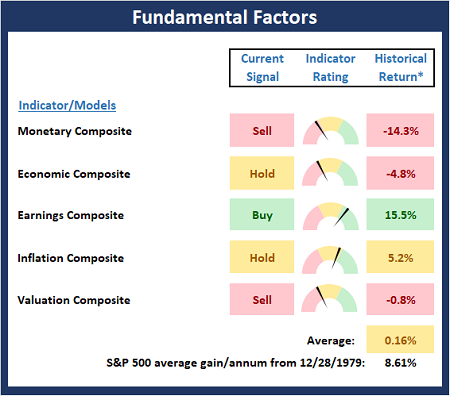
* Source: Ned Davis Research (NDR) as of the date of publication. Historical returns are hypothetical average annual performances calculated by NDR.
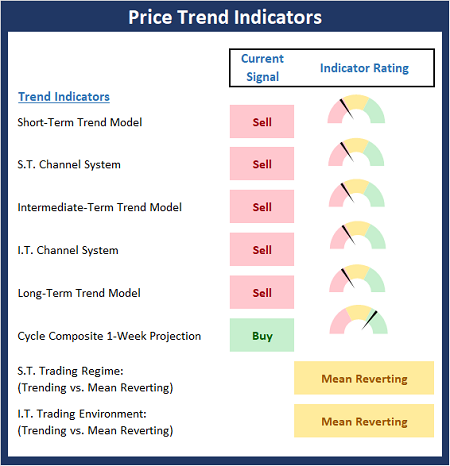
The State of the Trend
After reviewing the big-picture models and the fundamental backdrop, I like to look at the state of the current trend. This board of indicators is designed to tell us about the overall technical health of the market's trend.
The State of Internal Momentum
Next, we analyze the momentum indicators/models to determine if there is any "oomph" behind the current move.
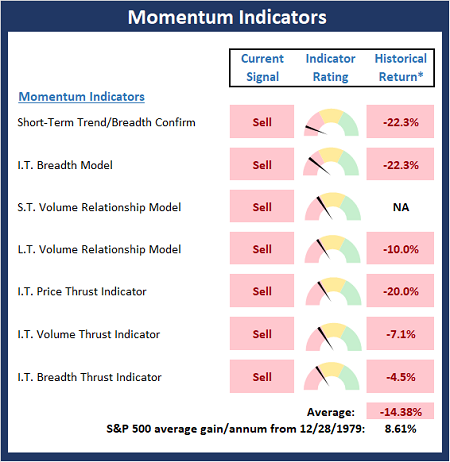
* Source: Ned Davis Research (NDR) as of the date of publication. Historical returns are hypothetical average annual performances calculated by NDR.
Early Warning Indicators
Finally, we look at our early warning indicators to gauge the potential for countertrend moves. This batch of indicators is designed to suggest when the table is set for the trend to "go the other way."
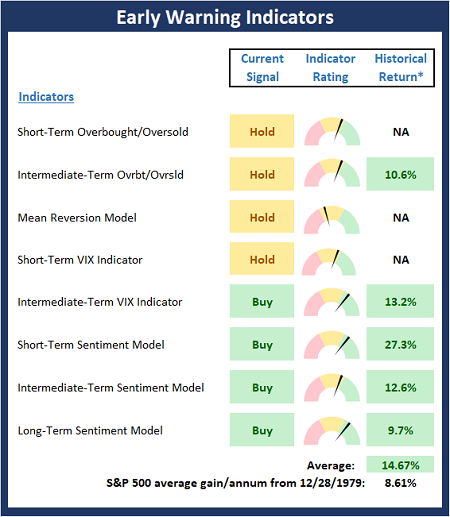
* Source: Ned Davis Research (NDR) as of the date of publication. Historical returns are hypothetical average annual performances calculated by NDR.
Thought for the Day:
You're never a loser until you quit trying. -Mike Ditka
Wishing you green screens and all the best for a great day,

David D. Moenning
Founder, Chief Investment Officer
Heritage Capital Research, a Registered Investment Advisor

Disclosures
At the time of publication, Mr. Moenning held long positions in the following securities mentioned: None - Note that positions may change at any time.
NOT INDIVIDUAL INVESTMENT ADVICE. IMPORTANT FURTHER DISCLOSURES