The Rate Trade Remains In Play
The State of the Market
I'm traveling for the next week, so the plan is to keep my oftentimes meandering market missive brief and to the point. So... From my seat, the key driver to the current market is the action in the bond market. In short, it appears that there are now two types of trading sessions in the stock market these days, depending on which direction rates are moving.
What I call session "A" occurs when rates rise. This causes the computers to sell the high growth and high P/E names (I.E. most of last year's winners) and buy the value/cyclical space. One of the best ways to "see" this action is to watch the QQQ. If rates are up, the Q's tend to be down, oftentimes down hard, while the smallcap names rally. I like to watch the IWM as a proxy here.
Session "B" tends to take place when rates pull back. In response, traders buy the high growth stocks and sell the value/cyclicals. As such, IWM drops and the Q's bounce.
Granted, this is an oversimplified generalization. But, one thing I have learned over the last 34 years is that Wall Street traders love their trading trends. So, I feel it is important to understand what "the trade" is at any given time.
This morning, rates are pulling back. Thus, the Q's are up and IWM is down. Granted, some upbeat views on Tesla is certainly aiding the NASDAQ 100. However, I see this as a "A" day. And this is the way the game will go while this rate-induced "trade" remains in play. Rinse and repeat. Until the next "trade" surfaces, of course!"
Here's hoping you have a great week. Now let's turn to our expanded weekly model update...
Weekly Model Review
Each week we do a deep dive into our key market indicators and models. The overall goal of this exercise is to (a) remove emotion from the investment process, (b) stay "in tune" with the primary market cycles, and (c) remain cognizant of the risk/reward environment.
The Big-Picture Market Models
We start with six of our favorite long-term market models. These models are designed to help determine the "state" of the overall market.
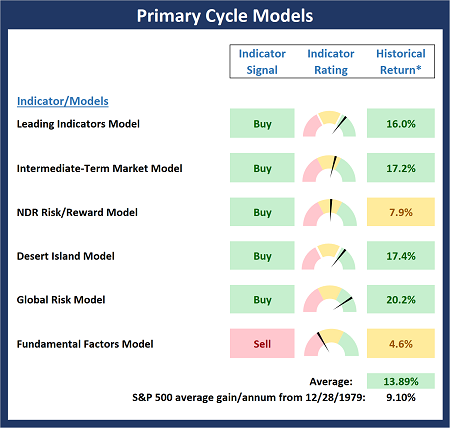
* Source: Ned Davis Research (NDR) as of the date of publication. Historical returns are hypothetical average annual performances calculated by NDR.
The Fundamental Backdrop
Next, we review the market's fundamental factors including interest rates, the economy, earnings, inflation, and valuations.
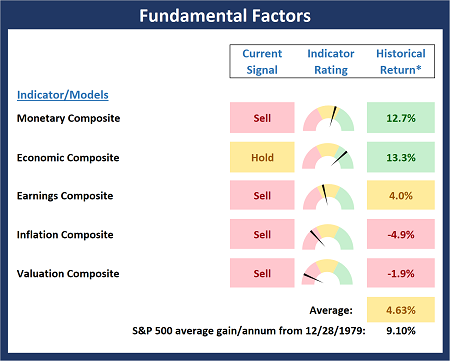
* Source: Ned Davis Research (NDR) as of the date of publication. Historical returns are hypothetical average annual performances calculated by NDR.
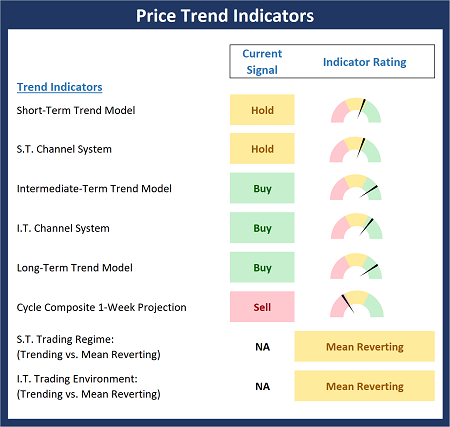
The State of the Trend
After reviewing the big-picture models and the fundamental backdrop, I like to look at the state of the current trend. This board of indicators is designed to tell us about the overall technical health of the market's trend.
The State of Internal Momentum
Next, we analyze the momentum indicators/models to determine if there is any "oomph" behind the current move.
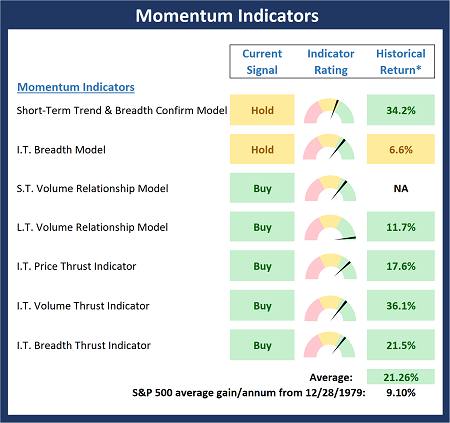
* Source: Ned Davis Research (NDR) as of the date of publication. Historical returns are hypothetical average annual performances calculated by NDR.
Early Warning Signals
Finally, we look at our early warning indicators to gauge the potential for counter-trend moves. This batch of indicators is designed to suggest when the table is set for the trend to "go the other way."
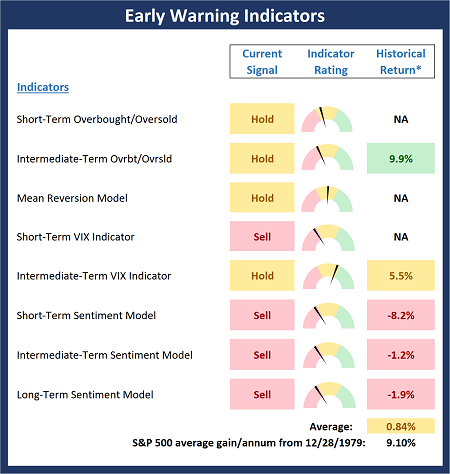
* Source: Ned Davis Research (NDR) as of the date of publication. Historical returns are hypothetical average annual performances calculated by NDR.
Thought for the Day:
The only thing necessary for evil to triumph is for good men to do nothing. -Sir Edmund Burke
Wishing you green screens and all the best for a great day,

David D. Moenning
Founder, Chief Investment Officer
Heritage Capital Research, a Registered Investment Advisor

Disclosures
At the time of publication, Mr. Moenning held long positions in the following securities mentioned: None - Note that positions may change at any time.
NOT INDIVIDUAL INVESTMENT ADVICE. IMPORTANT FURTHER DISCLOSURES