The Song Remains The Same
Executive Summary:
As the title of this morning's report indicates, the condition of the Early Warning board is largely unchanged. It is clear that stocks are overbought, and it can easily be argued that "the table is set" for some downside action. However, I continue to believe that stocks are currently entrenched in what I call a "good overbought" condition. So, until the bears can come up with a raison d'etre for more than a day or two here and there, I will continue to give the bulls the edge and opine that a "buy the dip" strategy remains appropriate.
The State of the "Early Warning" Indicators
As a reminder, I believe one of the keys to longevity in the investing business is having a repeatable process. Thus, I start each week with a review of the state of the big-picture environment. I then look at the current trend and the degree of momentum behind the move. Next, I explore the potential for a countertrend move to develop via our Early Warning Indicator Board, which is designed to indicate when "the table might be set" for the trend to "go the other way" for a while.
In looking the Early Warning board, my take is the odds for some downside price action are elevated (note that the none of the indicator gauges are in the green zone). However, it is important to recognize that our furry friends have had the table set for them for some time now and have not been able to do get anything going. So, although the market remains overbought and the board continues to favor some countertrend action I'm giving the bulls the benefit of doubt here.
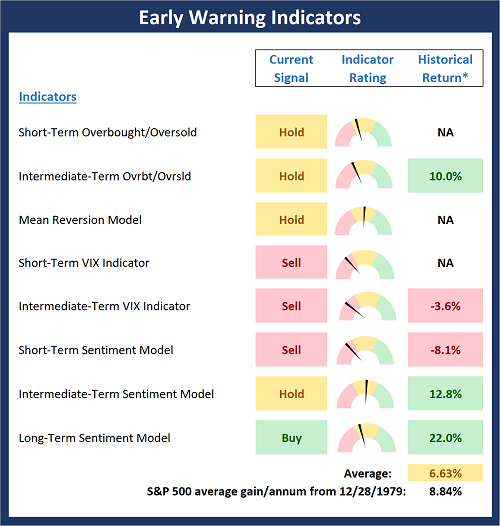
* Source: Ned Davis Research (NDR) as of the date of publication. Historical returns are hypothetical average annual performances calculated by NDR. Past performances do not guarantee future results or profitability - NOT INDIVIDUAL INVESTMENT ADVICE.
View Early Warning Indicator Board Online
Stochastic Review
Over the years, I have found that reviewing the basic stochastics is a solid way to determine when an index or security may be ripe to "go the other way" for a while. I like to keep it simple here by using a 14 day %K (with 1-day smoothing) and a 3 day %D. It's not fancy, but it tends to be an effective tool for an oftentimes complex subject.
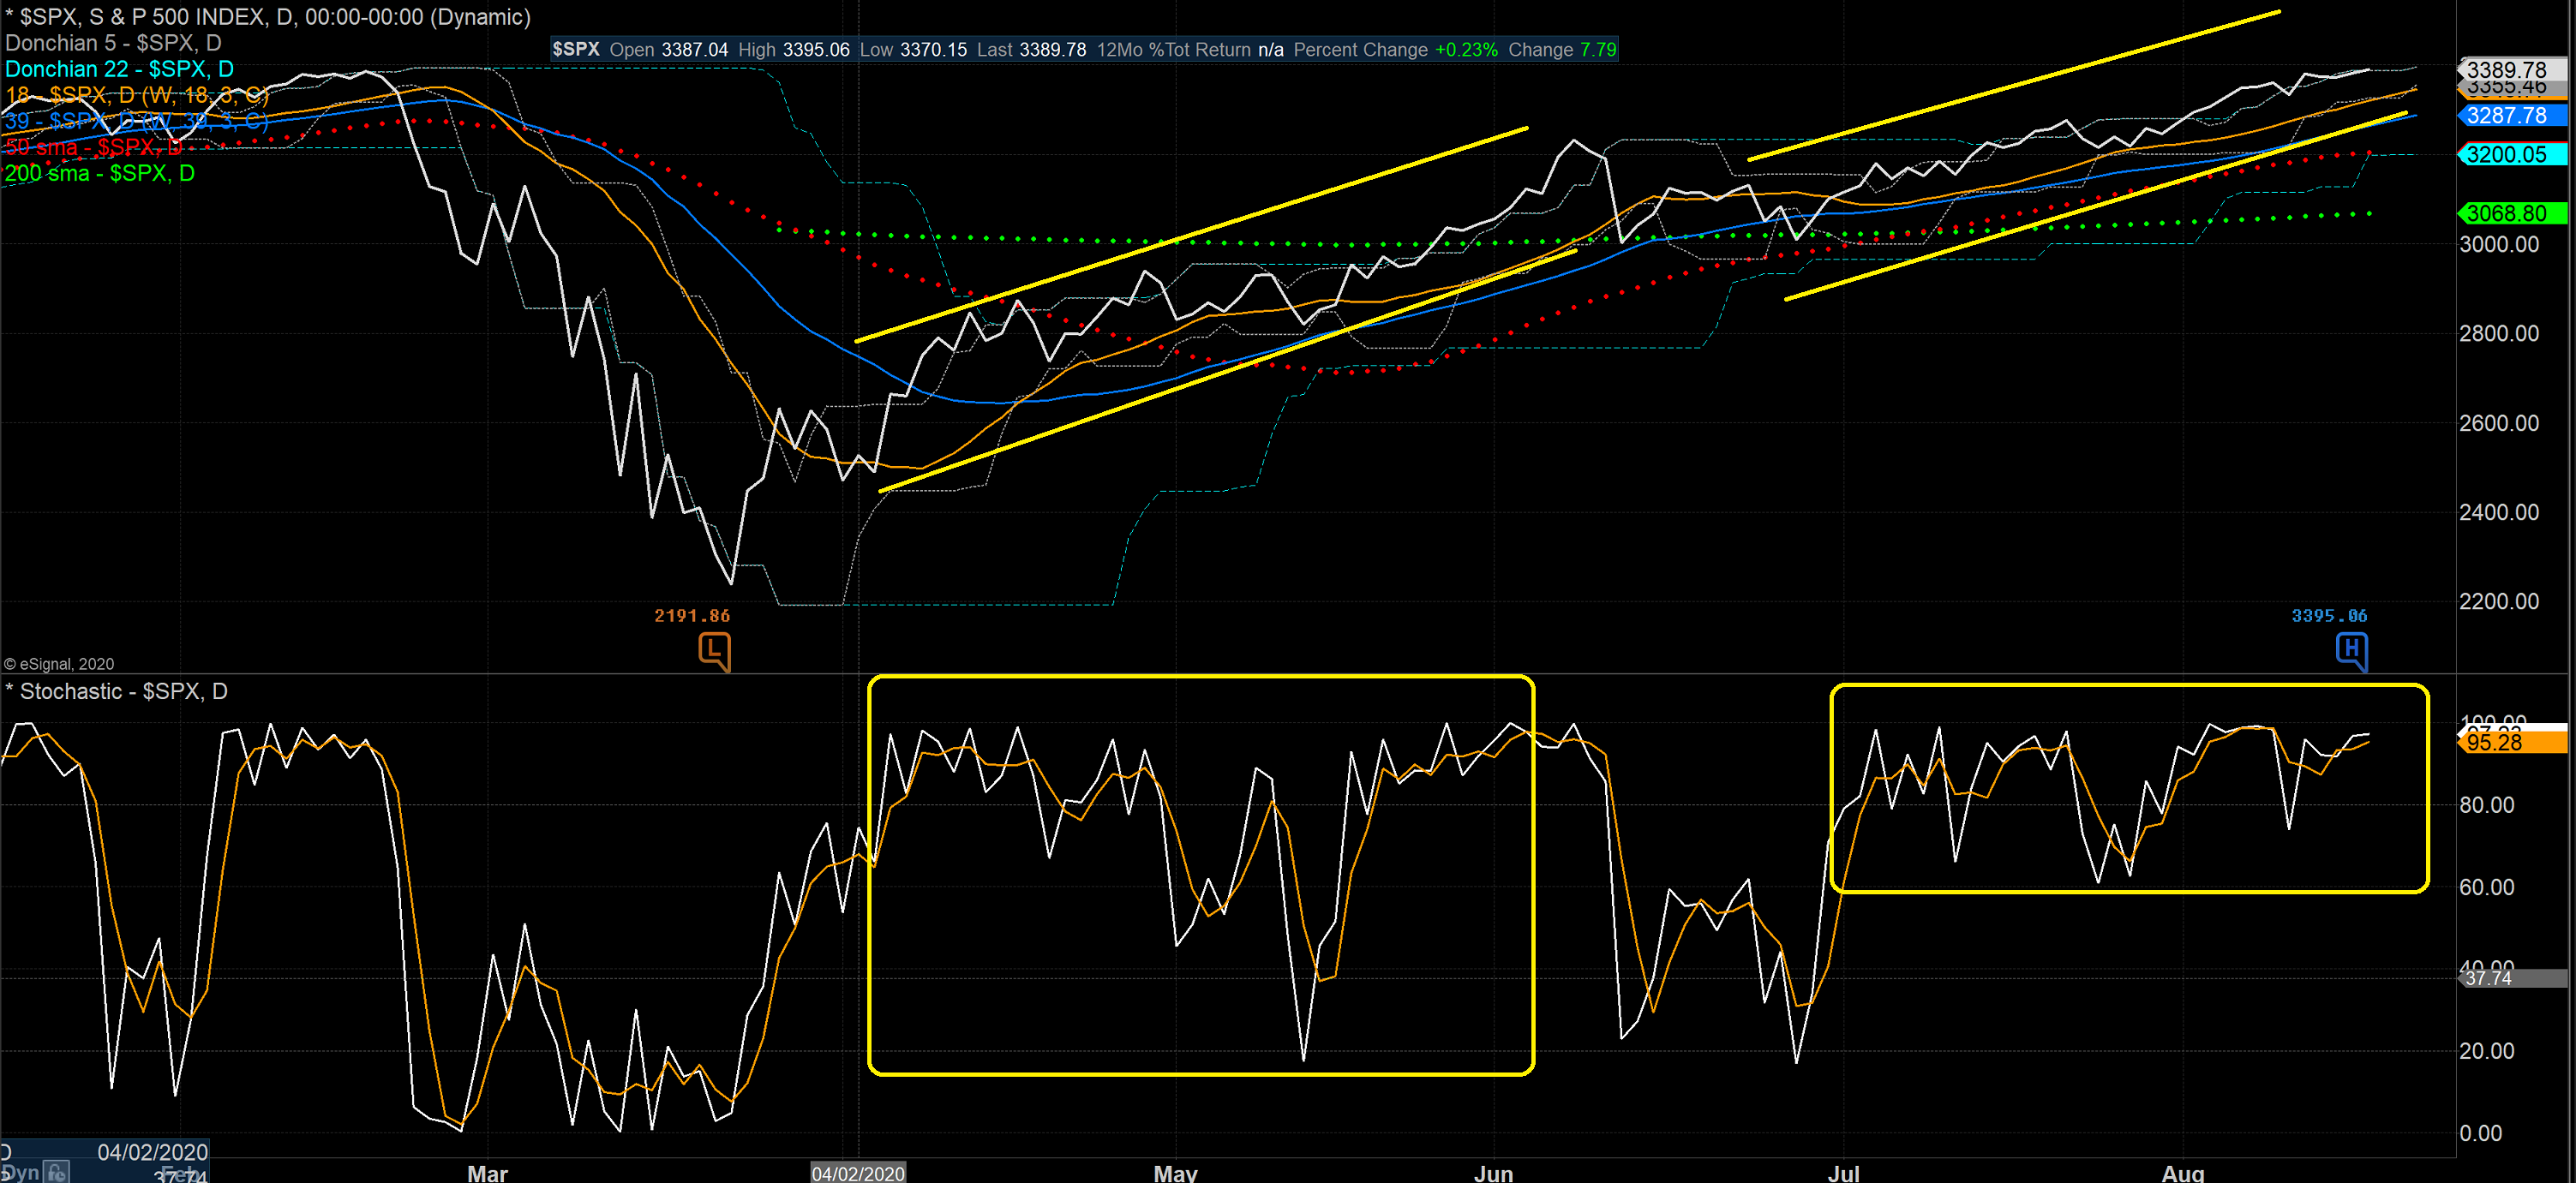
S&P 500 - Daily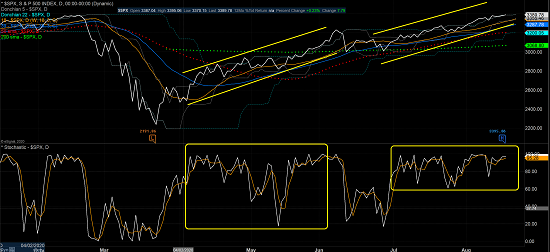
View Larger Chart
The song remains the same here too as the stochastics suggest that we have a "good overbought" condition on our hands. As can be seen on the chart, the S&P has been unable to create any sort of oversold condition since early July. And while this can easily change at the drop of a headline/algo, I'm going to need to see more than a brief dip into oversold territory to get me off the bull train/trend.
Yes, the "good overbought" condition will end at some point - they always do. Something always comes along to convince the "fast money" to do some selling. But when it does, it will be important to see if the selling lasts more than a day or two. If not, then the "good overbought" condition will remain in place and the dip will represent another opportunity to add exposure.
Publishing Note: I have an early commitment tomorrow morning and will not publish a report.
Thought For The Day:
The time of maximum pessimism is the best time to buy, and the time of maximum optimism is the best time to sell. -Sir John Templeton
Wishing you green screens and all the best for a great day,

David D. Moenning
Founder, Chief Investment Officer
Heritage Capital Research

Disclosures
At the time of publication, Mr. Moenning held long positions in the following securities mentioned: None - Note that positions may change at any time.
Early Warning Models Explained
Short-Term Overbought/sold Indicator: This indicator is the current reading of the 14,1,3 stochastic oscillator. When the oscillator is above 80 and the %K is above the %D, the indicator gives an overbought reading. Conversely, when the oscillator is below 20 and %K is below its %D, the indicator is oversold.
Intermediate-Term Overbought/sold Indicator: This indicator is a 40-day RSI reading. When above 57.5, the indicator is considered overbought and wnen below 45 it is oversold.
Mean Reversion Model: This is a diffusion model consisting of five indicators that can produce buy and sell signals based on overbought/sold conditions.
VIX Indicator: This indicators looks at the current reading of the VIX relative to a series of Donchian Channel bands. When the indicator reaches an extreme reading in either direction, it is an indication that a market trend could reverse in the near-term.
Short-Term Sentiment Indicator: This is a model-of-models composed of 18 independent sentiment indicators designed to indicate when market sentiment has reached an extreme from a short-term perspective. Historical analysis indicates that the stock market's best gains come after an environment has become extremely negative from a sentiment standpoint. Conversely, when sentiment becomes extremely positive, market returns have been subpar.
Intermediate-Term Sentiment Indicator: This is a model-of-models composed of 7 independent sentiment indicators designed to indicate when market sentiment has reached an extreme from a intermediate-term perspective. Historical analysis indicates that the stock market's best gains come after an environment has become extremely negative from a sentiment standpoint. Conversely, when sentiment becomes extremely positive, market returns have been subpar.
Long-Term Sentiment Indicator: This is a model-of-models composed of 6 independent sentiment indicators designed to indicate when market sentiment has reached an extreme from a long-term perspective. Historical analysis indicates that the stock market's best gains come after an environment has become extremely negative from a sentiment standpoint. Conversely, when sentiment becomes extremely positive, market returns have been subpar.
NOT INVESTMENT ADVICE. The opinions and forecasts expressed herein are those of Mr. David Moenning and Heritage Capital Research and may not actually come to pass. The opinions and viewpoints regarding the future of the markets should not be construed as recommendations. The analysis and information in this report is for informational purposes only. No part of the material presented in this report is intended as an investment recommendation or investment advice. Neither the information nor any opinion expressed constitutes a solicitation to purchase or sell securities or any investment program.
Any investment decisions must in all cases be made by the reader or by his or her investment adviser. Do NOT ever purchase any security without doing sufficient research. There is no guarantee that the investment objectives outlined will actually come to pass. All opinions expressed herein are subject to change without notice. Neither the editor, employees, nor any of their affiliates shall have any liability for any loss sustained by anyone who has relied on the information provided.
Mr. Moenning of Heritage Capital Research is an investment adviser representative of Eastsound Capital Advisors, LLC, a registered investment advisor. The adviser may not transact business in states where it is not appropriately registered, excluded or exempted from registration. Individualized responses to persons that involve either the effecting of transaction in securities, or the rendering of personalized investment advice for compensation, will not be made without registration or exemption.
Mr. Moenning and Heritage Capital Research may at times have positions in the securities referred to and may make purchases or sales of these securities while publications are in circulation. Positions may change at any time.
The analysis provided is based on both technical and fundamental research and is provided "as is" without warranty of any kind, either expressed or implied. Although the information contained is derived from sources which are believed to be reliable, they cannot be guaranteed.
The author neither endorses nor warrants the content of this site, any embedded advertisement, or any linked resource. The author or his managed funds may hold either long or short positions in the referenced securities. Republication rights must be expressly granted by author in writing.
Investments in equities carry an inherent element of risk including the potential for significant loss of principal. Past performance is not an indication of future results.