The State of the Market (In Two Bullet Points)
I was recently tasked with providing a summary of the current market environment in, wait for it, two bullet points. As long-time readers of my oftentimes meandering market missive will likely agree, brevity isn't exactly my strong suit. But, I decided to give it a try by accepting the challenge.
After spending a good thirty minutes pondering the contents of my limited bullet points - and avoiding the urge to "cheat" by incorporating multiple observations within each bullet point - I came up with the following:
Key Observations on the US Stock Market:
- A Slow-Moving Herd
- Peak Everything
To be fair, I can still probably be accused of cheating the task a bit as both bullets likely require some explanation in order to get the full meaning. So, since this report has no requirement for the aforementioned succinct verbiage, allow me to do a little explainin'.
The first point could have easily been, "It's a bull market until proven otherwise." For me, this almost says it all as my primary goal as a money manager is to "get it mostly right, most of the time" by staying in line with the market's primary trend. And to be sure, the primary trend continues to be up and to the right.
The subpoint in bullet number one was intended to put a slightly finer point on 2021's environment, which I will describe as "a slow grind higher." While I'm unlikely to get much pushback on this one, exhibits A and B in my argument include the seven straight monthly gains for the S&P 500 and the fact that according to my charts, the S&P has only spent two trading days below its 50-day moving average since November 4, 2020.
Other arguments include the subdued nature of the VIX this year as well as the fact that the largest pullback on a closing basis for the S&P 500 has been just 4.2% - a decline that occurred in Feb/Mar. As such, it's been a minute since the market has experienced even a "garden variety" correction of 5% or so (something that according to Ned Davis Research, has occurred every 51 trading days on average).
Granted, there have been a lot of things to be concerned about along the way. There's Delta, inflation, Fed policy, shortages, supply chain interruptions, etc. But through it all, our heroes in horns have remained undeterred. Onward and upward has been the mantra as the bulls argue that the macro outlook continues to improve (as long as you can "assume away" some of the near-term stuff, that is).
Bullet point number two also has some subtleties associated with it. The key is that we are likely seeing (or have seen) this cycle's peak for, well, just about everything. GDP. Earnings. Job creation. Inflation. Valuations. Fiscal and monetary stimulus. And so on.
Although I have argued that these "peaks" don't mean much this time around due to the artificial nature of the current business cycle, we must recognize that things are indeed slowing down.
Yes, the current slowdown can easily be blamed on Delta and the surge in COVID cases/hospitalizations/deaths among the nonvaccinated. Yes, this surge will likely run its course over time. And yes, I believe we aren't likely to see dramatic measures such as lockdowns and/or the government dropping "helicopter money" any time soon.
From my seat, the key seems to be that Wall Street continues to look past the impact of COVID. To the better days ahead. To renewed growth once we can return to what is likely to be a new normal.
If we've learned anything from COVID (from a cold-hearted business/market perspective, that is) it is that Corporate America is very good at adapting to change - and making money, no matter the challenges presented.
Yet, given the "slow grind higher" and the lack of any real counterargument from our furry friends in the bear camp, many on Wall Street believe that it's time for, at the very least, a pause in the action.
Just last week we got warnings from some big-name outfits. First, Goldman Sachs dropped their growth projections for Q4 and 2021 citing the impact of Delta, fading stimulus, and a slower recovery in the services sector. Citi warned about the extreme levels of bullish sentiment, saying any correction could easily become amplified. Morgan Stanley actually cut their ratings on equities, suggesting "the next 2 months carry outsized risk to growth" and thus, could be bumpy. In addition, Deutsche Bank warned that the risks of a correction have increased due to valuations and the state of the earnings cycle.
Right on cue, stocks began to pull back a bit last week. And while the extent of the decline so far has been less than 2% (-1.92% according to my calculations), the bottom line is many investors are turning cautious here.
For me, the key risks include the possibilities that (a) the Delta-induced slowdown becomes larger than expected, (b) the Fed makes a policy mistake, and (c) inflation becomes a problem.
On the latter, note that we will get the reading of August's CPI tomorrow morning. The consensus seems to be that a monthly increase of 0.4% is the line in the sand. Anything above may cause the market angst, while readings below would seem to support the Fed's "transient" narrative.
So, there you have it. While there are reasons for concern at this stage of the game, my take is the bulls remain in charge and should be given the benefit of the doubt. My guess is that the market will continue to be driven by the state of COVID in the coming weeks. Thus, I'll continue to track the infection/hospitalization/death date and trends.
Now let's review the state of the market from a modeling perspective...
The Big-Picture Market Models
We start with six of our favorite long-term market models. These models are designed to help determine the "state" of the overall market.
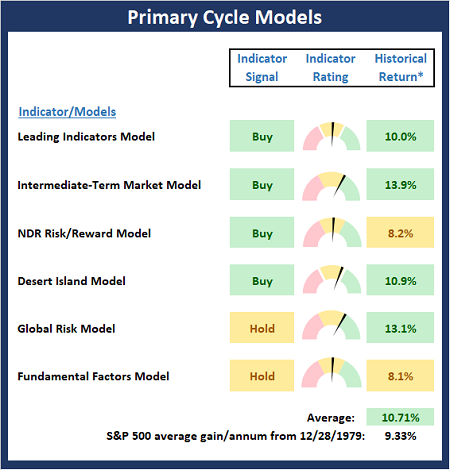
* Source: Ned Davis Research (NDR) as of the date of publication. Historical returns are hypothetical average annual performances calculated by NDR.
The Fundamental Backdrop
Next, we review the market's fundamental factors including interest rates, the economy, earnings, inflation, and valuations.
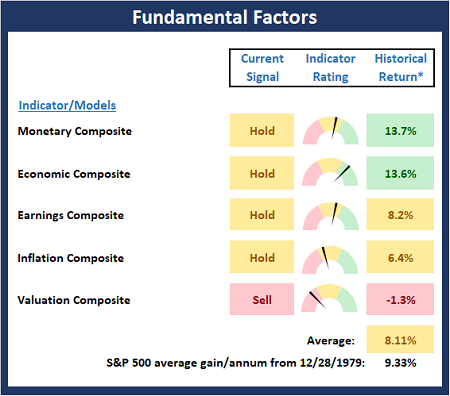
* Source: Ned Davis Research (NDR) as of the date of publication. Historical returns are hypothetical average annual performances calculated by NDR.
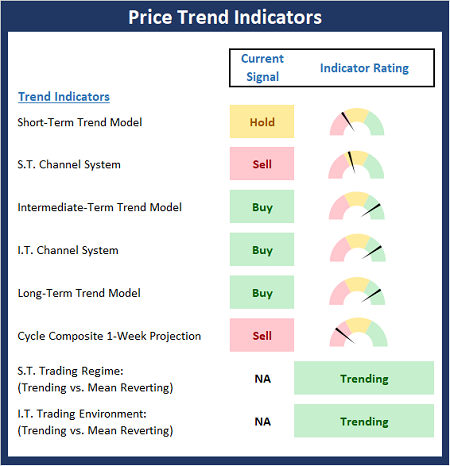
The State of the Trend
After reviewing the big-picture models and the fundamental backdrop, I like to look at the state of the current trend. This board of indicators is designed to tell us about the overall technical health of the market's trend.
The State of Internal Momentum
Next, we analyze the momentum indicators/models to determine if there is any "oomph" behind the current move.
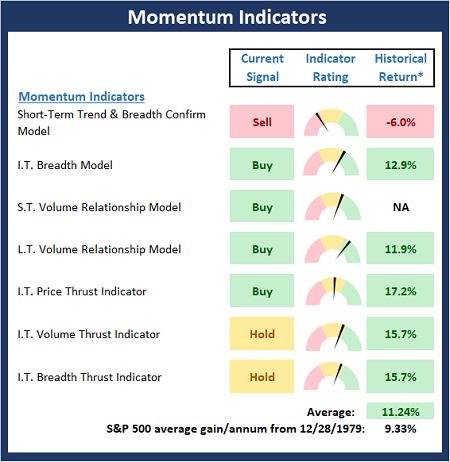
* Source: Ned Davis Research (NDR) as of the date of publication. Historical returns are hypothetical average annual performances calculated by NDR.
Early Warning Signals
Finally, we look at our early warning indicators to gauge the potential for counter-trend moves. This batch of indicators is designed to suggest when the table is set for the trend to "go the other way."
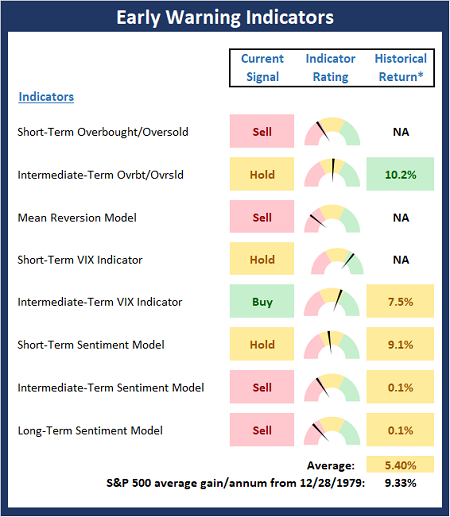
* Source: Ned Davis Research (NDR) as of the date of publication. Historical returns are hypothetical average annual performances calculated by NDR.
Thought for the Day:
Let yourself be silently drawn by the strange pull of what you really love. It will not lead you astray. -Rumi
Wishing you green screens and all the best for a great day,

David D. Moenning
Founder, Chief Investment Officer
Heritage Capital Research, a Registered Investment Advisor

Disclosures
At the time of publication, Mr. Moenning held long positions in the following securities mentioned: None - Note that positions may change at any time.
NOT INDIVIDUAL INVESTMENT ADVICE. IMPORTANT FURTHER DISCLOSURES