The State of the Markets 8.8.22
I am short on time this morning, so I am going to try something a little different this week. As part of my daily market analysis, I keep a running log (in brief, bullet-point format) of all key news/events/happenings in the market. The goal is to stay on top of everything in order to both understand and stay in tune with what IS occurring in the markets and why.
Below is my executive summary of everything you need to know about what is going on in the stock and bond markets...
Key Points:
- Market’s rebound off low has been based on peak inflation and peak Fed hawkishness narratives, as well as hope/expectation that the ensuing economic slowdown will be modest
- Primary driver of peak Fed hawkishness was Powell saying that Fed could pivot if data warranted
- Traders looking ahead to point in time when Fed can pivot
- Market pricing in 50-75 bps at Sept, another 50-100 bps in rest of 2022, and rate cut in Q2/3 2023 (July 2023 current expectation)
- But 4 Fed Presidents pushed back this week saying inflation fight far from over
- Bears say pivot narrative is premature
- As of August 3, S&P has rebounded 13.3% off bottom
- Growth displaying leadership again
- S&P at key resistance
- Short-term Overbought
- Sentiment becoming headwind near-term
- Positive technical action
- Indexes held up in face of surge in yields in response to jobs report
- Higher lows
- Can S&P now make intermediate-term higher high?
- NDX has made I.T. higher high
- Breadth Thrust buy signals
- 3 of 5 indicators now on buys, triggers Model Buy Signal
- NDR says Breadth Thrust signals suggest new bull market has begun as opposed to bear market rally (although new Bull is not an official call by NDR)
- IMPORTANT: Economy not in recession with Nominal GDP at 7.3%
- Friday jobs report eases recession talk/fears
- Transitory Update: Cleveland Fed’s CPI Estimate for July: 0.27% (June was 1.32%)
- Would be lowest since January 2021
- UofM Consumer Sentiment – Expectations still weak and falling
- Biggest Macro Question: Will inflation come down enough for Fed to move out of fast lane?
- For now, path of least resistance seems to be to upside
Items of Note:
- GDPNow Q3 reading is +1.4% as of 8/4
- Note: Real GDP print negative due to inflation being higher than nominal GDP
- Nominal GDP: 6.6% Q1, 7.3% Q2
- Real GDP: -1.6% Q1, -0.9% Q2
- Cycle Composite pointing higher through September
- China Manufacturing PMI fell into contraction territory (Eurozone already in contraction)
- China July services activity expands at quickest pace in 15 months
- SBUX CEO Howard Schultz said customers haven’t pulled back on their spending or traded down to cheaper items despite persistently hot inflation.
- BoE hiked 0.50% Thursday, predicts recession to begin in Q4 and last a year, inflation to peak in October
- BTIG’s Jonathan Krinsky told CNBC he’s watching the 4,231 level on the S&P 500 for confirmation that the low is in. He said that level represents a 50% Fibonacci retracement from the June lows, noting that: "Since 1950 there has never been a bear market rally that exceeded the 50% retracement and then gone on to make new cycle lows. Therefore, if the SPX were to exceed 4231, we would have to assume that June was the low for this cycle."
- 30-year mortgage rate below 5% - lowest since April
- Global Food prices fall ~9% in July, lowest level since January
- Global Supply Chain Stress falls to lowest level since January 2021
Federal Reserve
- Monday: Minnesota Fed Pres Kashkari says markets getting ahead of themselves in anticipation Fed pivot. Said Fed is "a long ways away from 2% target" and is committed to achieving the goal.
- Tuesday: Fed's Daly said the Fed's work on inflation is nowhere near done, while also stressing need to make good on commitment to tightening. Fed's Mester said she is looking for compelling evidence inflation has peaked and is moving down, and she has not seen that yet. Chicago's Evans also said year-end 2023 fed funds rate could near 4.00%, or 50 bp above market expectations.
- Wednesday: Bullard said fed funds rate will likely have to go to 3.75%-4.0% by year-end, implying another 150 bp of tightening, while reiterating Fed may be able to slow inflation without triggering a recession.
- Thursday: Mester says Fed needs to raise rates to a little above 4% to ease demand
Market Action
Monday: Sideways session after big run last week
Tuesday: Stocks opened lower on Taiwan tensions, fell further on hawkish Fedspeak from Daly, Mester, Evans. Yields surged.
Wednesday: Stronger than expected ISM Non-Manufacturing and sigh-of-relief relating to Taiwan led to rally
Thursday: Quiet day – waiting on Jobs report
Friday: Stocks/Bonds opened lower on strong jobs report. Yields surged to 2.84%. However, stocks held up pretty well in back-n-forth session.
Economics
Monday
- July ISM Manufacturing 52.8 v 52.0, June 53.0
- Lowest level since June 2020
- Reminder: Above 50 = Expansion
- July Markit Manufacturing PMI 52.2 v 52.3, June 52.3
- June Construction Spending -1.1% v 0.2%, May 0.1% (from -0.1%)
Tuesday
- JOLTS: Job openings fell 5.4% in June. 3rd consecutive decline.
Wednesday
- July ISM Non-Manufacturing 56.7 v 53.5, June 55.3
- New Orders 59.9 v 55.6 June
- July S&P Global Services PMI 47.3 v 47.0, June 52.7
- June Factory Orders 2.0% v 1.2%, May 1.8% (from 1.6%)
Friday
- July Nonfarm Payrolls 528K v 250K, June 398K from 372K, May 386K from 384K
- Largest monthly increase since February
- Unemployment Rate 3.5% v 3.6%, June 3.6%
- Average Weekly Hours 34.6 v 34.6, June 34.6 from 34.5
- Average Hourly Earnings 0.5% v 0.3%, June 0.4 from 0.3%
- Labor force participation rate 62.1% v June 62.2%
Bull Case:
- Earnings from “Generals” strong
- Peak inflation narrative
- Peak Fed hawkishness narrative
- Increased buyback activity
- Falling commodity prices
- Strong labor market (Too strong?)
- Strong consumer balance sheet (cash in bank) and spending
- Pullback in Yields
- Improved Valuations
- Current decline in line with non-recession bears
Bear Case:
- Market over its skis with Fed pivot expectations
- Parts of economy slowing at rapid rate
- Inflation has NOT peaked yet
- Money Supply Growth is negative
- Valuations remain historically stretched
- Inverted yield curve (But not all curves are inverted)
- Relentless rise in dollar
- Odds of recession continue to rise (ex: Morgan Stanley 38%)
- Earnings estimates risk (Q3/4)
Now let's review the "state of the market" through the lens of our market models...
The Big-Picture Market Models
We start with six of our favorite long-term market models. These models are designed to help determine the "state" of the overall market.
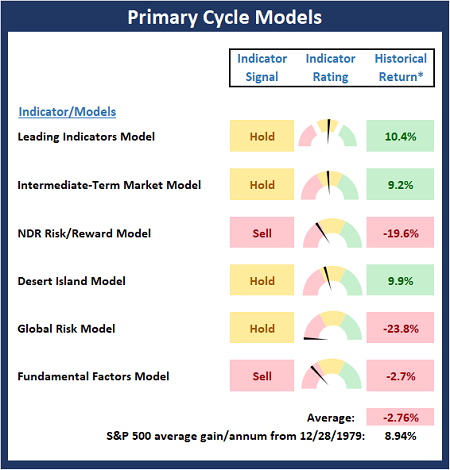
* Source: Ned Davis Research (NDR) as of the date of publication. Historical returns are hypothetical average annual performances calculated by NDR.
The Fundamental Backdrop
Next, we review the market's fundamental factors including interest rates, the economy, earnings, inflation, and valuations.
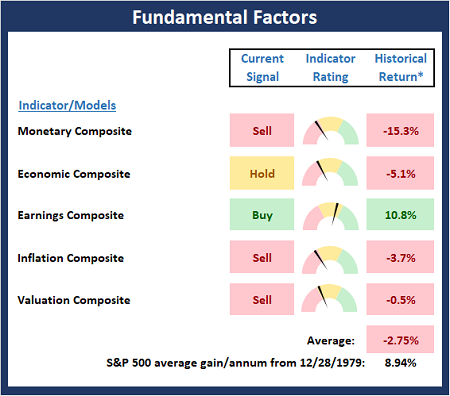
* Source: Ned Davis Research (NDR) as of the date of publication. Historical returns are hypothetical average annual performances calculated by NDR.
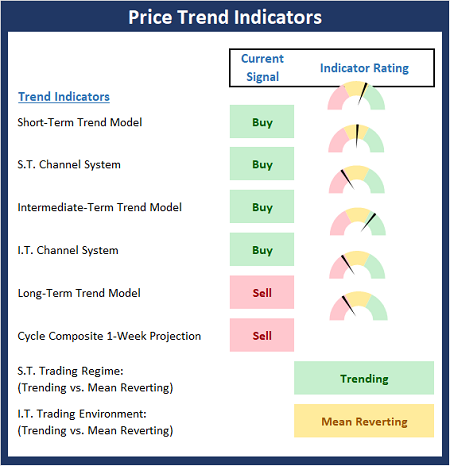
The State of the Trend
After reviewing the big-picture models and the fundamental backdrop, I like to look at the state of the current trend. This board of indicators is designed to tell us about the overall technical health of the market's trend.
The State of Internal Momentum
Next, we analyze the momentum indicators/models to determine if there is any "oomph" behind the current move.
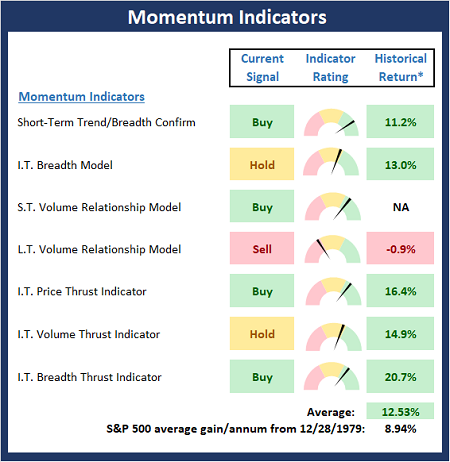
* Source: Ned Davis Research (NDR) as of the date of publication. Historical returns are hypothetical average annual performances calculated by NDR.
Early Warning Indicators
Finally, we look at our early warning indicators to gauge the potential for countertrend moves. This batch of indicators is designed to suggest when the table is set for the trend to "go the other way."
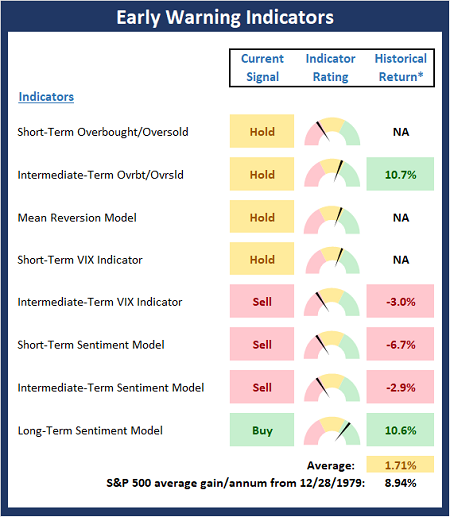
* Source: Ned Davis Research (NDR) as of the date of publication. Historical returns are hypothetical average annual performances calculated by NDR.
Thought for the Day:
Go after your dream, no matter how unattainable others think it is. -Linda Mastandrea
Wishing you green screens and all the best for a great day,

David D. Moenning
Founder, Chief Investment Officer
Heritage Capital Research, a Registered Investment Advisor

Disclosures
At the time of publication, Mr. Moenning held long positions in the following securities mentioned: None - Note that positions may change at any time.
NOT INDIVIDUAL INVESTMENT ADVICE. IMPORTANT FURTHER DISCLOSURES