Thoughts On The Correction, Fundamentals, and Valuations
Before we get to our weekly review of market fundamentals, let's look at the state of the current pullback happening in the stock market.
After a 3-day pummeling of the market leaders that appeared to be triggered by the combination of extreme overbought conditions, excessive speculation, exuberant optimism, and some options/vol trades unwinding, traders got a bounce on Wednesday. And while it looked like the bounce had some legs in the early going Thursday, the rally quickly failed and sellers returned. As such, investors went home Thursday more than a little concerned.
The question was if Thursday's drubbing was the end of the selling or a sign that the correction has further to run. Obviously, we can't know the answer in advance. But I have learned over the years that we can look around for clues that could suggest the potential outcome.
In looking at a chart of the S&P 500, there are a couple items to note.
S&P 500 - Daily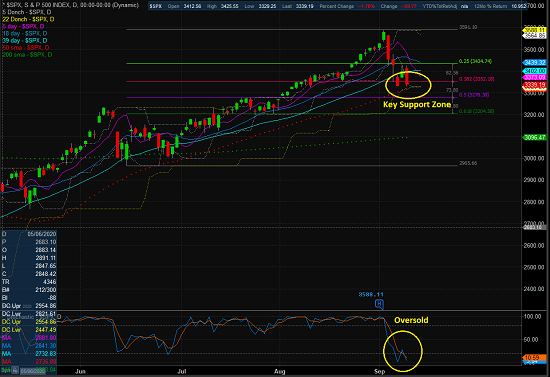
View Larger Chart
First, in the lower clip of the chart, we can see that the index is now oversold. While this doesn't necessarily give the bulls an edge, my view is the oversold condition removes an edge of the bear camp's side of the ledger.
Next up is the question of support on the charts. When stocks advance quickly, they can find themselves far away from any support zone (this was the case early last week). As such, a vacuum of buyers is created once meaningful selling begins. In short, when things get overdone to the upside, professionals know to "stand aside" once the selling begins and wait for more logical spots to start fighting.
As I've indicated on the chart, I think the 3340 to 3280 zone represents key support for the S&P 500 index. This morning, the bulls are trying to defend their turf. However, should they fail, a test of the 50-day is almost assured. Next, let's recognize that a break would likely accelerate the selling. After that, there is some decent support at 3280 and then again at 3205. For me, these areas represent important battlegrounds and likely turning points - IF the bulls can find their mojo again, of course.
Finally, let's remember that the current pullback of around 7% on the S&P 500 qualifies as a "garden variety" correction. And given the froth that was in the market early last week, the move certainly seemed justified to me. The question from here is if the worries over unemployment, the economic recovery, the fall Flu/COVID combo, taxes, the calendar, and additional stimulus will take root. If so, don't be surprised if we embark on a more protracted correction/consolidation.
As I stated yesterday, my base case is that we are experiencing a well-deserved consolidation within the context of an ongoing cyclical bull market. Things had gotten out of hand and the bulls needed a rest. This is that rest. That's my story and I'm sticking to it (for now, anyway).
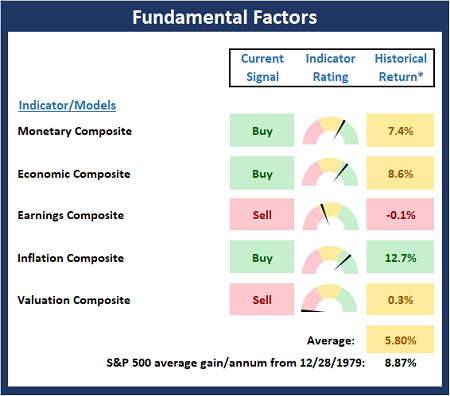
The State of the Fundamental Models...
There are no changes to the Fundamental Factors board this week. Monetary conditions remain positive on balance, our economic composite is holding steady, earnings continue to be a question mark, inflation expectations are on the rise but from very low levels, and valuations remain extremely high. All things considered, I believe the board continues to favor the bulls from a big-picture, intermediate- to long-term standpoint.
View Fundamental Indicator Board Online
* Source: Ned Davis Research (NDR) as of the date of publication. Historical returns are hypothetical average annual performances calculated by NDR. Past performances do not guarantee future results or profitability - NOT INDIVIDUAL INVESTMENT ADVICE.
A Word On Valuations...
Lots of folks are very nervous about the state of market valuations. However, I believe it is important to remember that valuations tend to surge as recessions end and recoveries begin. The reason is simple; as traders begin to discount better days, the "P" (price) in the P/E ratio rises while the "E" (earnings) continues to lag as a result of the economic slowdown. Since it takes a while for the "E" to recover (earnings are reported quarterly after all), we can expect P/E ratios to stay high for at least a couple quarters. So, from my seat, as long as the economic recovery remains on track, we don't need to fret too much over valuations here - especially given the level of interest rates and the fact that the Fed has pledged to remain friendly for quite some time.
Thought For The Day:
Failure is the opportunity to begin again more intelligently. -Henry Ford
Wishing you green screens and all the best for a great day,

David D. Moenning
Founder, Chief Investment Officer
Heritage Capital Research

Disclosures
At the time of publication, Mr. Moenning held long positions in the following securities mentioned: AAPL - Note that positions may change at any time.
Fundamental Models Explained
Monetary Composite: The popular cliche, "Don't fight the Fed" is really a testament to the profound impact that interest rates and Fed policy have on the market. It is a proven fact that monetary conditions are one of the most powerful influences on the direction of stock prices. The Monetary Composite is a combination of two proprietary monetary models developed by Ned Davis Research. The first is comprised of 14 indicators and is plotted as a composite and the second is made up of eight monetary-related indicators including money supply, and the bond and commodities markets.
Economic Composite: During the middle of bull and bear markets, understanding the overall health of the economy and how it impacts the stock market is one of the few truly logical aspects of the stock market. The economic composite is a series of three models designed to indicate the current state of the economy.
Earnings Composite: A series of four models designed to indicate the overall health of corporate earnings. The first model is based on the slope of the smoothed S&P 500 earnings per share. The second model looks at the drivers of earnings and includes indicators such as U.S. industrial production, the CRB Spot Raw Industrial Material Price Index, the Treasury yield curve, Institute for Supply Management (ISM) indices, corporate bond credit spreads, unemployment claims, and the trend in analyst earnings estimate revisions for the S&P 500. The third model is designed to indicate the likely trend in the earnings per share reported for the S&P 500 Index. This model uses a variety of macro variables to indicate whether current conditions are favorable for strong, moderate, or weak growth in S&P 500 earnings. The fourth model the median 12-month percent change in the one-year analyst forecast out of the 500 components of the index.
Inflation Model: From an historical perspective, one of the best "big picture" indicators of what the market is expected to do next is inflation. The Inflation model is designed to identify cyclical changes in the rate of inflation. The model consists of 22 individual indicators primarily measuring various rates of change of such indicators as commodity prices, the Consumer Price Index (CPI), producer prices, and industrial production.
Valuation Composite: If you want to get analysts really riled up, you need only to begin a discussion of market valuation. While the question of whether stocks are overvalued or undervalued appears to be a simple one, the subject is actually extremely complex. The Valuation composite consists of five valuation indicators/models developed by Ned Davis Research. The first valuation indicator reviews the S&P 500 Price-to-Earnings GAAP Ratio relative to normal, expensive, and bargain valuation zones. The second model measures the S&P 500’s Median P/E ratio, representing the median P/E of the 500 stocks in the index. The third model measures the Median P/E ratio of a multi-cap stock index. The fourth indicator is the P/E ratio of the Value Line Index. The fifth model is a composite of 7 indicators designed to reflect stock market valuations based on how various valuation indicators compare to their latest 10-year historical ranges.
NOT INVESTMENT ADVICE. The opinions and forecasts expressed herein are those of Mr. David Moenning and Heritage Capital Research and may not actually come to pass. The opinions and viewpoints regarding the future of the markets should not be construed as recommendations. The analysis and information in this report is for informational purposes only. No part of the material presented in this report is intended as an investment recommendation or investment advice. Neither the information nor any opinion expressed constitutes a solicitation to purchase or sell securities or any investment program.
Any investment decisions must in all cases be made by the reader or by his or her investment adviser. Do NOT ever purchase any security without doing sufficient research. There is no guarantee that the investment objectives outlined will actually come to pass. All opinions expressed herein are subject to change without notice. Neither the editor, employees, nor any of their affiliates shall have any liability for any loss sustained by anyone who has relied on the information provided.
Mr. Moenning of Heritage Capital Research is an investment adviser representative of Eastsound Capital Advisors, LLC, a registered investment advisor. The adviser may not transact business in states where it is not appropriately registered, excluded or exempted from registration. Individualized responses to persons that involve either the effecting of transaction in securities, or the rendering of personalized investment advice for compensation, will not be made without registration or exemption.
Mr. Moenning and Heritage Capital Research may at times have positions in the securities referred to and may make purchases or sales of these securities while publications are in circulation. Positions may change at any time.
The analysis provided is based on both technical and fundamental research and is provided "as is" without warranty of any kind, either expressed or implied. Although the information contained is derived from sources which are believed to be reliable, they cannot be guaranteed.
The author neither endorses nor warrants the content of this site, any embedded advertisement, or any linked resource. The author or his managed funds may hold either long or short positions in the referenced securities. Republication rights must be expressly granted by author in writing.
Investments in equities carry an inherent element of risk including the potential for significant loss of principal. Past performance is not an indication of future results.