Three Negatives and One Ginormous Positive
The State of the Market: Executive Summary
Three negatives and one ginormous positive. From my seat, this defines the current stock market environment. The negatives can more accurately be described as uncertainties and all are well worn: (1) The breathtaking surge in coronavirus cases, (2) the election, and (3) the state of/outlook for economic recovery. IMO, this combination is enough to warrant a sloppy period and even some downside volatility. However, the good news is there appears to be an offset - and it's a whopper. Stimulus. Both monetary and fiscal. In short, my take is the bulls have got perhaps the friendliest Fed in history on their side as well as another stimulus package coming from the government, which many analysts believe will help support economic growth going forward.
From my seat, the positives appear to outweigh the negatives as Wall Street is a place that loves easy money. And with the Fed clearly set to keep rates "lower for longer" and another trillion dollars or so coming from Washington at some point in the coming months, it is hard for me to get overly negative here.
Sure, the part of the economy impacted by social distancing (restaurants, cruises, airlines, movies, concerts, professional sports, etc.) will continue to struggle mightily given the surge in coronavirus cases. However, the good news is the rest of the economy appears to be doing just fine, thank you. And some areas (think homebuilders and online shopping) are growing even faster now than they were before the pandemic began. For me, this represents a pretty sturdy floor to economic activity. And in turn, a limit to how much damage the bears might be able to justify at this time.
So... My plan remains the same. Stay patient and use weakness to put dry powder to work.
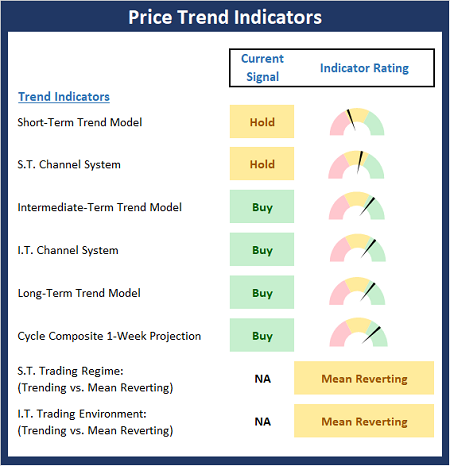
The State of the Trend Indicators
Although the price action turned ugly to start the week, the Trend Board remains in decent shape. So, until/unless the bears can start to inflict some real technical damage, we should probably view the action as a continuation of the consolidation phase that has been in place since late August.
NOT INDIVIDUAL INVESTMENT ADVICE.
About The Trend Board Indicators: The models/indicators on the Trend Board are designed to determine the overall technical health of the current stock market trend in terms of the short- and intermediate-term time frames.
My Take on the State of the Charts...
Looking at a chart of the S&P 500, it is clear to me that we're still in the midst of a consolidation phase. During these "sloppy periods," the daily price action can and certainly has been, quite volatile. And with a VIX reading above 32 this morning, it is reasonable to expect the recent volatile to continue. But from a bigger picture standpoint, index movements remain inside the recent range - and as such, aren't terribly meaningful. Yet, at the same time, it is interesting to note that price is currently sitting at a fairly important technical juncture (near-term support and the 50-day). The bulls would prefer to see this area hold without any further downside testing - and a move higher from here could qualify as a "cup with a handle" formation. However, any further selling could easily lead to a test of the lower end of the range. But for me, the key is the fact that this remains a rangebound environment.
S&P 500 - Daily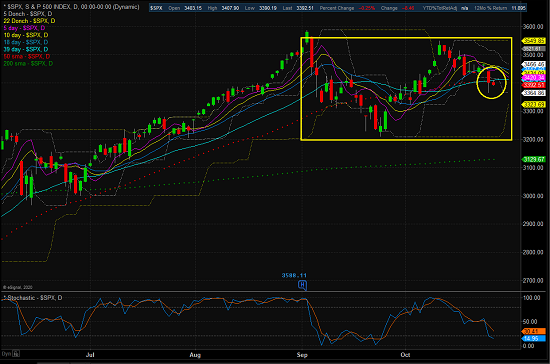
View Larger Chart
Next, let's check in on the state of the market's internal momentum indicators.
The Momentum board has faltered a bit since our last report as two of our thrust indicators flipped to negative. Both our intermediate-term volume and breadth thrust indicators issued sell signals at the start of the week. However, the readings of both indicators are not overly negative at this time. As such, the board continues to give a slight edge to the bulls at this time.
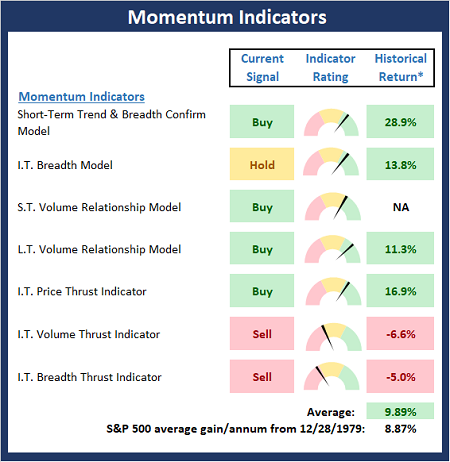
* Source: Ned Davis Research (NDR) as of the date of publication. Historical returns are hypothetical average annual performances calculated by NDR. Past performances do not guarantee future results or profitability - NOT INDIVIDUAL INVESTMENT ADVICE.
Thought For The Day:
No one can make you feel inferior without your consent. -Eleanor Roosevelt
Wishing you green screens and all the best for a great day,

David D. Moenning
Founder, Chief Investment Officer
Heritage Capital Research, an SEC Registered Investment Advisor

Disclosures
At the time of publication, Mr. Moenning held long positions in the following securities mentioned: none - Note that positions may change at any time.
Trend Models Explained
Short-Term Trend Model: A series of indicator designed to identify the status of the stock market’s short-term (0-3 weeks) trend. The model compares the current price of S&P 500 relative to 5-day customized smoothing (weighted and moved forward 3 periods), the relationship of the 5-day to the 10-day, and the relationship of 10-day to 39-day.
Short- and Intermediate-Term Channel Breakout Systems: The short-term and intermediate-term Channel Breakout Systems are modified versions of the Donchian Channel indicator. According to Wikipedia, "The Donchian channel is an indicator used in market trading developed by Richard Donchian. It is formed by taking the highest high and the lowest low of the last n periods. The area between the high and the low is the channel for the period chosen."
Intermediate-Term Trend Model: A model designed to identify the status of the stock market’s intermediate-term (3 weeks to 6 months) price trend. The model compares the current weekly price of S&P 500 relative to relative to customized 10-week smoothing (weighted and moved forward 3 periods), the relationship of the 10-week to the 30-week, and the relationship of 30-week to 55-week.
Long-Term Trend Model: An indicator designed to identify the status of the stock market’s longer-term (>6 months) trend. The indicator compares the 50-day smoothing of the S&P 500 relative to its 200-day smoothing. When the 50-day is above 200-day, the indicator is positive and vice versa.
Cycle Composite Projections: The cycle composite combines the 1-year Seasonal, 4-year Presidential, and 10-year Decennial cycles. The indicator reading shown uses the cycle projection for the upcoming week.
Short- and Intermediate-Term Trading Mode Models: These indicators attempt to identify whether the current market action represents a "trending" or "mean reverting" environment. The indicator utilizes the readings of the Efficiency Ratio, the Average Correlation Coefficient, and Trend Strength models.
Momentum Models Explained
Short-Term Trend-and-Breadth Model: History shows the most reliable market moves tend to occur when the breadth indices are in tune with the major market averages. When the breadth measures diverge, investors should take note that a trend reversal may be at hand. This indicator incorporates an All-Cap Dollar Weighted Equity Series and A/D Line. At the time of this writing, when the A/D line has been above its 5-day smoothing and the All-Cap Equal Weighted Equity Series is above its 25-day smoothing, the equity index has gained at a rate of +26.5% per year since 1980. When one of the indicators is above its smoothing, the equity index has gained at a rate of +14.5% per year. And when both are below, the equity index has lost over -20% per year.
Intermediate-Term Breadth Model: A proprietary diffusion index developed by Ned Davis Research. The indicator is designed to determine the technical health of the market’s 157 sub-industry groups (GICS categorizes the market into 11 sectors, 20 industries, and 157 sub-industry groups). Technical health is determined by the direction of each sub-industry’s long-term smoothing and the rate of change of the sub-industry’s price index.
Short- and Long-Term Volume Relationship Models: These models review the relationship between "supply" and "demand" volume over the short- and intermediate-term time frames.
Intermediate-Term Price Thrust Model: This indicator measures the 3-day rate of change of the Value Line Composite relative to the standard deviation of the 30-day average.
Intermediate-Term Volume Thrust Model: This indicator uses NASDAQ volume data to indicate bullish and bearish conditions for the NASDAQ Composite Index. The indicator plots the ratio of the 10-day total of NASDAQ daily advancing volume to the 10-day total of daily declining volume. The indicator supports the case that a rising market supported by heavier volume in the advancing issues tends to be the most bullish condition, while a declining market with downside volume dominating confirms bearish conditions.
Breadth Thrust Model: This indicator uses the number of NASDAQ-listed stocks advancing and declining to indicate bullish or bearish breadth conditions for the NASDAQ Composite. The indicator plots the ratio of the 10-day total of the number of stocks rising on the NASDAQ each day to the 10-day total of the number of stocks declining each day. Using 10-day totals smooths the random daily fluctuations and gives indications on an intermediate-term basis. Historically, the NASDAQ Composite has performed much better when the 10-day A/D ratio is high (strong breadth) and worse when the indicator is in its lower mode (weak breadth). The most bullish conditions for the NASDAQ when the 10-day A/D indicator is not only high, but has recently posted an extreme high reading and thus indicated a thrust of upside momentum. Bearish conditions are confirmed when the indicator is low and has recently signaled a downside breadth thrust.
NOT INVESTMENT ADVICE. The opinions and forecasts expressed herein are those of Mr. David Moenning and Heritage Capital Research and may not actually come to pass. The opinions and viewpoints regarding the future of the markets should not be construed as recommendations. The analysis and information in this report is for informational purposes only. No part of the material presented in this report is intended as an investment recommendation or investment advice. Neither the information nor any opinion expressed constitutes a solicitation to purchase or sell securities or any investment program.
Any investment decisions must in all cases be made by the reader or by his or her investment adviser. Do NOT ever purchase any security without doing sufficient research. There is no guarantee that the investment objectives outlined will actually come to pass. All opinions expressed herein are subject to change without notice. Neither the editor, employees, nor any of their affiliates shall have any liability for any loss sustained by anyone who has relied on the information provided.
Mr. Moenning is an investment adviser representative of Heritage Capital Advisors, LLC dba Heritage Capital Research (HCR), an SEC registered investment advisor.
Mr. Moenning and HCR may at times have positions in the securities referred to and may make purchases or sales of these securities while publications are in circulation. Positions may change at any time.
The analysis provided is based on both technical and fundamental research and is provided "as is" without warranty of any kind, either expressed or implied. Although the information contained is derived from sources which are believed to be reliable, they cannot be guaranteed.
The author neither endorses nor warrants the content of this site, any embedded advertisement, or any linked resource. The author or his managed funds may hold either long or short positions in the referenced securities. Republication rights must be expressly granted by author in writing.
Investments in equities carry an inherent element of risk including the potential for significant loss of principal. Past performance is not an indication of future results.