Time To Take A Break?

The State of the Market
Stocks have danced merrily higher throughout November as traders have celebrated the idea that highly effective vaccines look to be just a few months away. Cutting to the chase, this means that investors have ignored the bad news about the surge in COVID cases, hospitalizations, and deaths, and instead have been busy looking ahead to a return to some form of normalcy - sooner rather than later.
The returns of the major indices have been historic and the areas of the market that had been hurt the most by the COVID pandemic have caught a consistent bid. For example, the laggards (i.e. smallcaps, midcaps, cyclicals, and value) have enjoyed an explosive reversion to the mean.
To be sure, the move makes sense as scientific experts have indicated that the vaccine can be expected to be widely distributed by Q2 of next year. As I've been opining of late, the key here is that this expectation falls within the time frame that Ms. Market tends to look ahead to.
However, in the stock market, too much of a good thing (as in a strong rally that nearly everyone embraces) can become a bad thing from a short-term perspective. And while this particular form of market analysis tends to be more art than science as rallies can and often do last far longer than one can imagine, it does appear that the rally might need to take a break here at some point.
In short, the news that matters has all been good lately and just about everybody on the planet can now recite the bull case - as well as why it is likely to continue to dominate. But as Ned Davis is famous for saying, "beware of the crowd at extremes." And to be sure, we've got one of those extremes on our hands at the present time.
Below are Exhibits A, B, C, and D in my argument. See what you think.
First up is CNN's Fear/Greed Index...
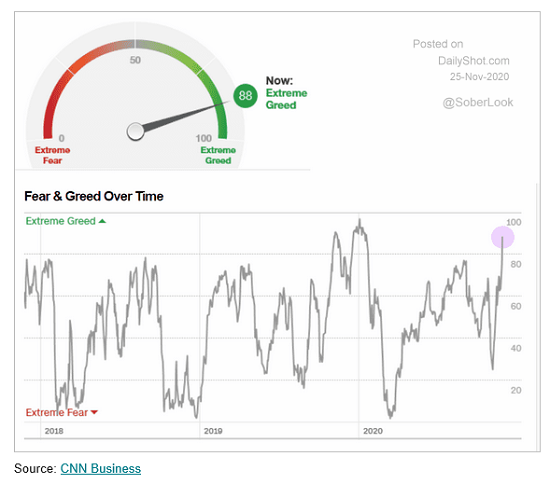
Source: The DailyShot
Next is Scotiabank's Panic/Euphoria Indicator...
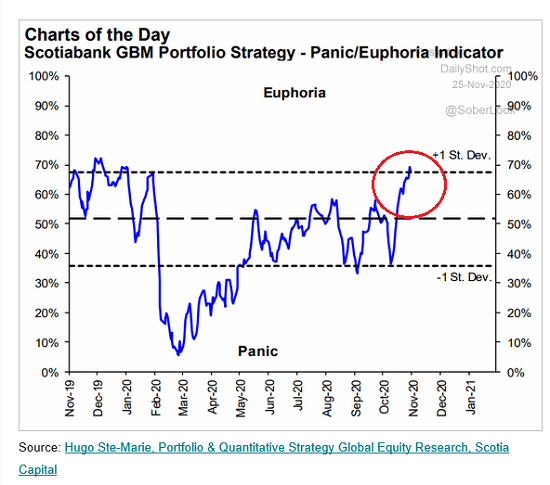
Source: The DailyShot
Then there is the Put/Call ratio, which is at a multi-year low...
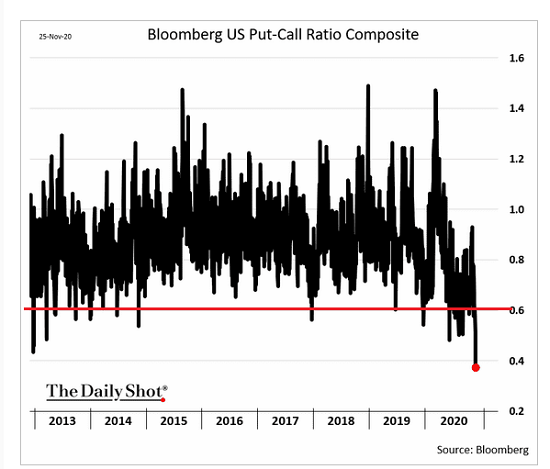
Source: The DailyShot
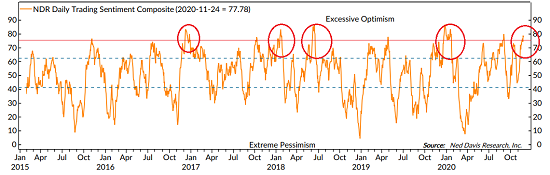
And finally, there is NDR's Daily Sentiment model, which from my perch, has reached an extreme...
View Full Size Chart Online
Source: Ned Davis Research Group
The takeaway here is that when overbought conditions are accompanied by extreme sentiment readings, it can be argued that "the table is set" for a countertrend move. A pullback. A sloppy period. A correction. Or a "pause that refreshes."
Another way to think about this situation is that the future's good news (a return to normalcy) may be quickly becoming priced in. As such, the question of the day is, how much of a good thing is too much?
To clarify, I am most definitely NOT suggesting that one become defensive at this time. No, I'm simply saying that we may be approaching the time when the bulls may want to take a break. You know, to catch their breath before they can embark on another romp higher. As such, I for one am not going to be surprised if the joyride to the upside we've seen in November begins to cool off a bit.
Now let's turn to the state of my favorite big-picture market models...
The Big-Picture Market Models
There are no changes to report on the Primary Cycle board again this week. From my seat, the message from the board is clear as the bulls remain in control of the game. However, it should be noted that from a short-term perspective, stocks are overbought and sentiment has become overly optimistic. As such, a pause/pullback/correction wouldn't be surprising.
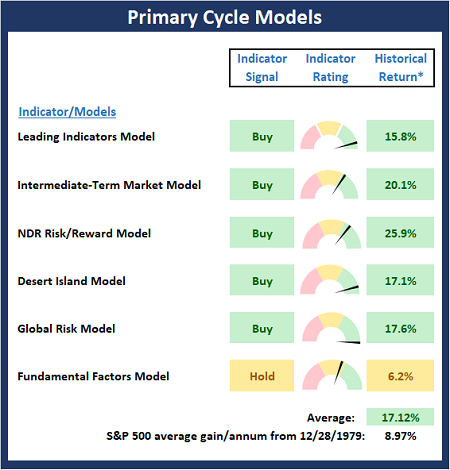
* Source: Ned Davis Research (NDR) as of the date of publication. Historical returns are hypothetical average annual performances calculated by NDR.
Checking On The "Primary" Cycles
While I don't often make portfolio adjustments based on the long-term trends in the stock market (aka the "primary cycles"), I have found over the years that checking in on state of the cycles and the weekly/monthly charts helps to keep the big-picture in perspective.
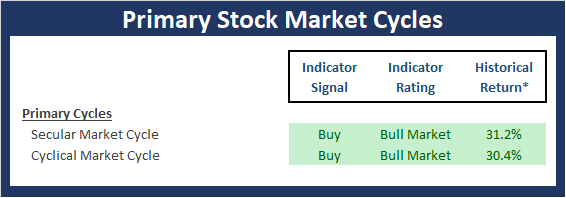
* Source: Ned Davis Research (NDR) as of the date of publication. Historical returns are hypothetical average annual performances calculated by NDR.
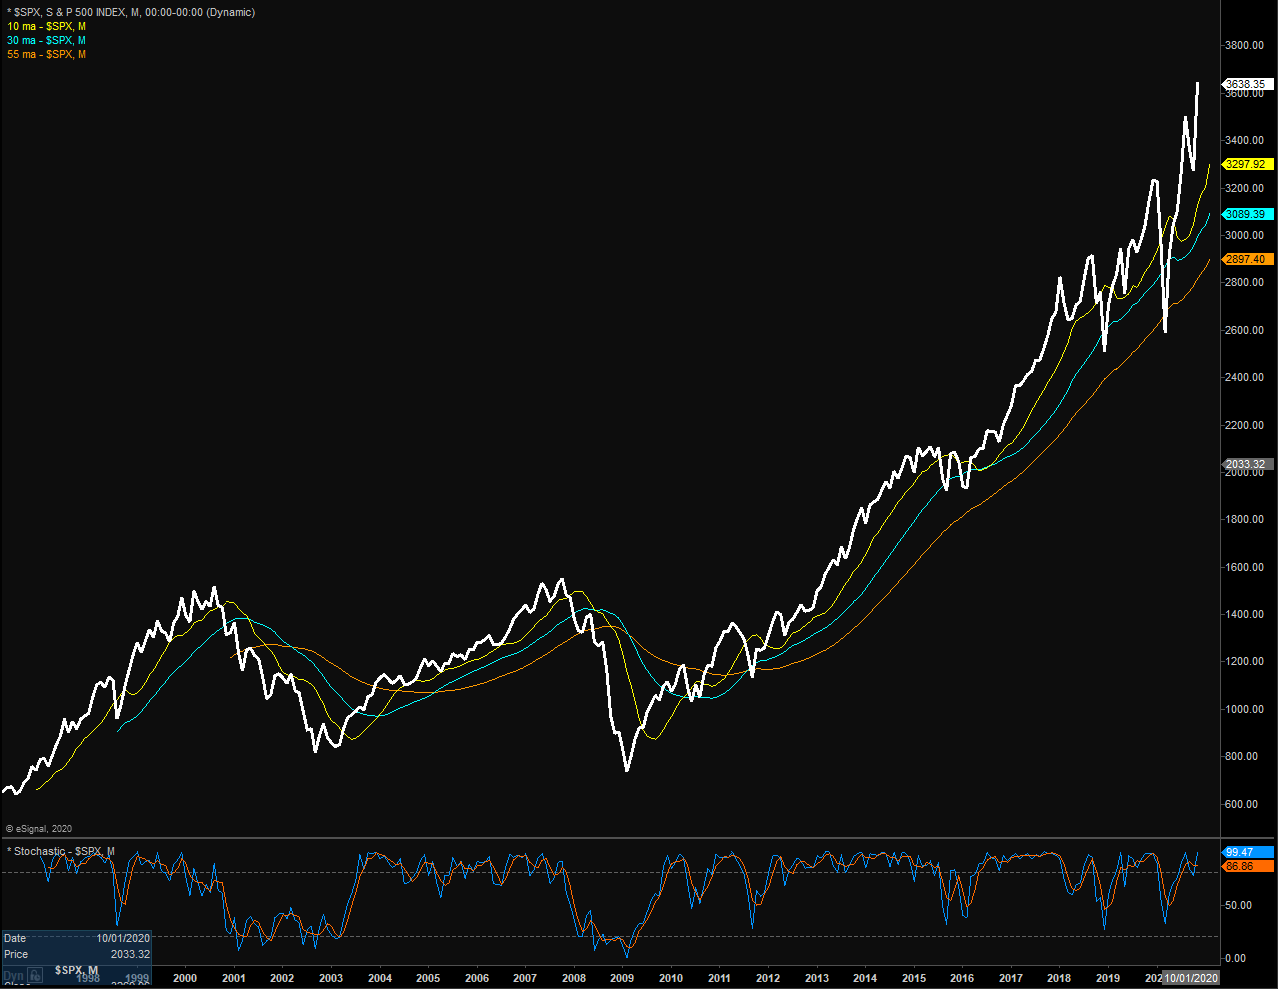
The Secular Market Cycle
Definition: A secular bull market is a period in which stock prices rise at an above-average rate for an extended period (think 5 years or longer) and suffer only relatively short intervening declines. A secular bear market is an extended period of flat or declining stock prices. Secular bull or bear markets typically consist of multiple cyclical bull and bear markets. Below is a monthly chart of the S&P 500 Index illustrating the current cycle, which we estimate began on March 9, 2009.
S&P 500 - Monthly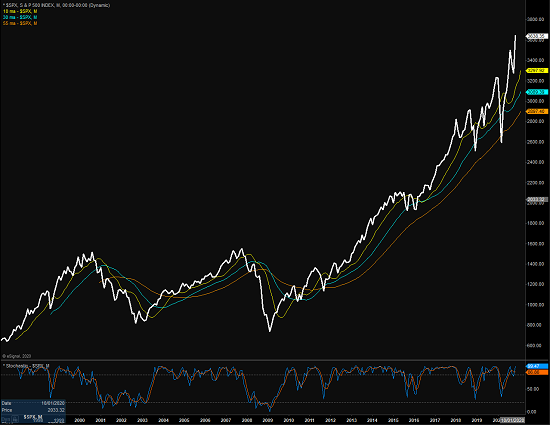
View Full Size Chart Online
The Cyclical Market Cycle
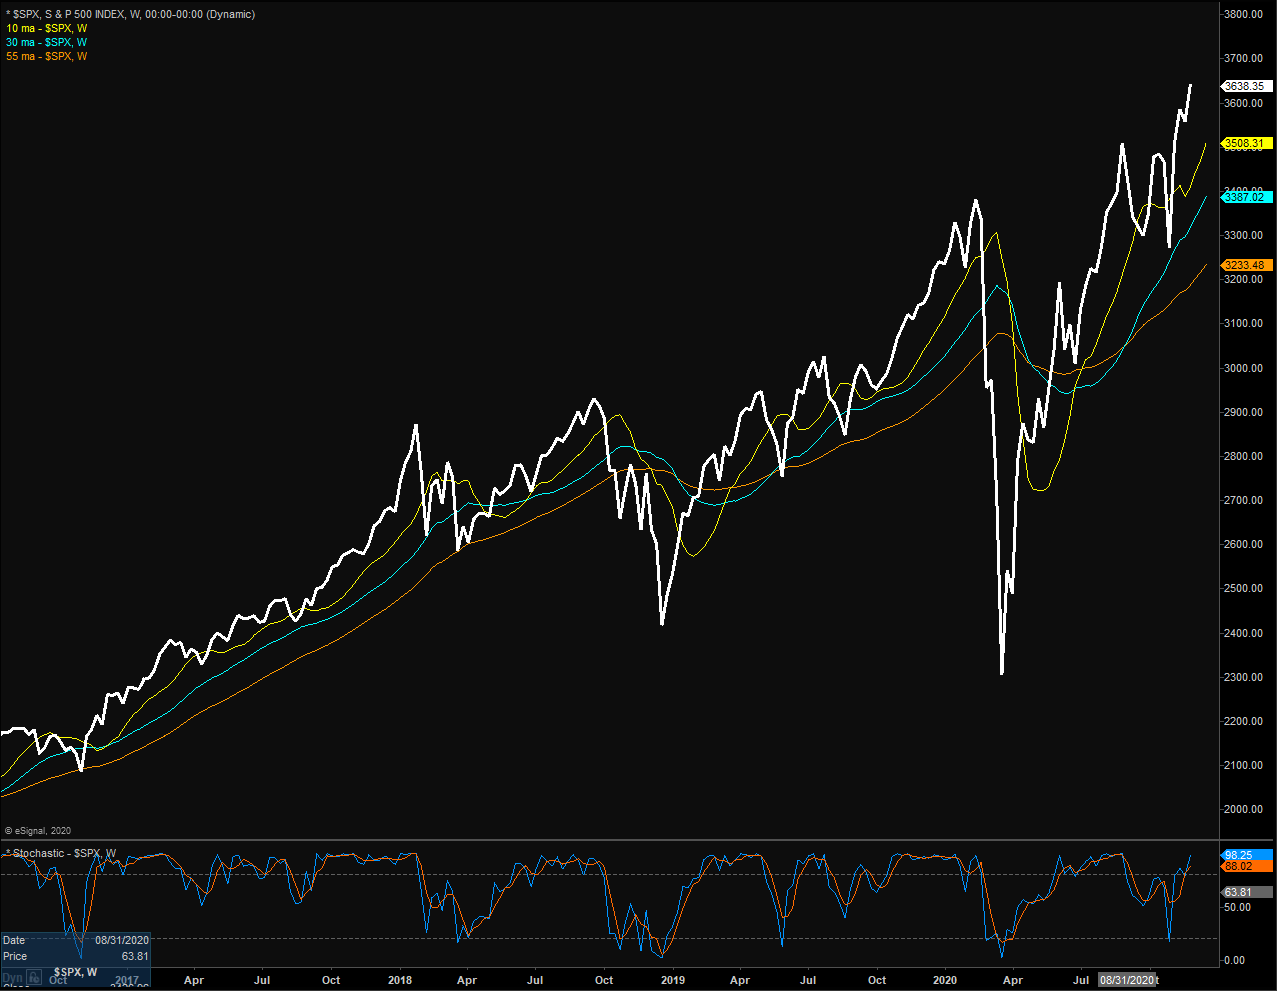
Definition: A cyclical bull market requires a 30% rise in the DJIA after 50 calendar days or a 13% rise after 155 calendar days. Reversals of 30% in the Value Line Geometric Index since 1965 also qualify. A cyclical bear market requires a 30% drop in the DJIA after 50 calendar days or a 13% decline after 145 calendar days. Reversals of 30% in the Value Line Geometric Index also qualify. Below is a weekly chart of the S&P 500 illustrating the current cycle, which we estimate began on March 24, 2020.
S&P 500 - Weekly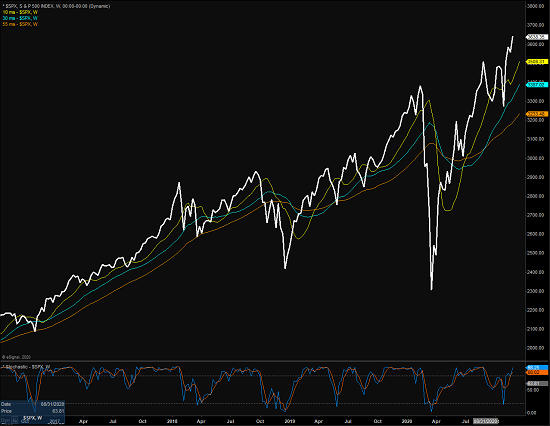
View Full Size Chart Online
Thought For The Day:
Bad times can be good for business - if you're ready for them. -Sandy Weill
Wishing you green screens and all the best for a great day,

David D. Moenning
Founder, Chief Investment Officer
Heritage Capital Research, an SEC Registered Investment Advisor

Disclosures
At the time of publication, Mr. Moenning held long positions in the following securities mentioned: none - Note that positions may change at any time.
NOT INDIVIDUAL INVESTMENT ADVICE. IMPORTANT FURTHER DISCLOSURES