Two Thoughts Before You Panic

Unless you've been living in a cave, you are likely aware that markets are in the midst of a rather violent "reset" as traders/investors reprice things for the changing environment in fast fashion. To be sure, Friday's option expiry and corresponding record day for options trading, as well as the obvious high-speed trading algo moves have likely accentuated/exaggerated the current decline. But, in any event, this is the way "corrections" act these days. One direction. In a hurry.
Analysts used to say that corrections were "normal and healthy" due to the idea that they often laid the groundwork for the next leg higher in the stock market. But, especially lately, the "normal and healthy" idea has fallen by the wayside quickly when the only color on your screen becomes red for days on end. During these one-way moves, it is easy to let your emotions get the best of you and succumb to that little voice in the back of your head screaming, "Make it stop!"
Investors can't be blamed for feeling some angst here. The S&P 500 is down 7.7% so far in 2022 and is off 8.3% from it's recent high (which, was set way back on day one of 2022). The DJIA has fared better and is off 6.9% from its high-water mark. But from there, things get worse as the S&P Midcaps are 10.8% from their highs, the NASDAQ 100 is down 12.9%, and the Russell 2000 small cap index is off 18.7%. All of which pales in comparison to former superstar Kathie Wood's ARK Innovation fund, which closed Friday 42.84% from its former high (and requires a gain of nearly 75% to return to said high).
When looking under the hood of the major indices, things actually look worse. For example, according to former Barron's columnist and current CNBC commentator, Michael Santolli, 30% of stocks in the S&P 500 are 20% off their highs and approximately 50% are down 15%. Oh, and 40% of the NASDAQ Composite constituents are now down 50%. Ouch!
I believe the key to the big declines in what were, for the most part, the former market darlings, is the idea of a "rethink" or "reset" of prices relative to the environment - which includes things like interest rates, inflation, and of course, growth expectations. When stirred together, this creates a recipe for what is called "multiple contraction." In English, this simply means investors are willing to pay less for those former high-flying stocks in the new normal that is 2022.
Looking at the broader market, the reasons for the current dance to the downside appear to include the following:
- The spike in interest rates
- Stubbornly high inflation
- Peaking growth (GDP and earnings)
- Multiple contraction
- Geopolitical: Russia/Ukraine
- Potential for Fed mistake
While we can never know for sure, I think it's that last bullet point that has been the major sticking point over the past week. Here's the deal (IMO, of course)...
The "liftoff" point for the Fed starting to raise rates (aka a Fed hiking cycle) has moved up recently. Currently the markets appear to expect rate hikes to begin in March. In addition, there is talk of the Fed accelerating the degree of rate increases. Currently there is a lot of talk about rate hikes of 0.50% each time, which is double what expectations were a month ago.
Then there is the idea of "QT" (quantitative tightening - i.e. the Fed selling its bond holdings). When combined with the idea of more aggressive rate hike cycle, you are left with the Fed not only NOT being "friendly" or supportive, and instead becoming "antagonistic" to markets.
Now for the really juicy part. Based on the talk of when the Fed may start implementing any/all of the above, the thinking is the Fed would be aggressively tightening right about the time the economic data could be confirming a slowdown. Not a desired result.
This is where the impact of Omicron really comes into play. The good news is, Omicron is much milder. But it is also 70X more transmissible. As such, this variant is EVERYWHERE! And in turn, boatloads of workers can't come to work due to isolation requirements for either being sick or exposed. This is creating new disruptions to both the economy and companies large and small. And the impact of this situation is likely to come to light in the next couple of months. Right when the Fed might be getting cookin' of course.
But before you sell everything and start loading up on those 3X Inverse ETFs, there are a couple of questions that investors may want to have answers to. First up is, will the Fed blink?
Lest we forget, the Fed has been in the position of trying to normalize monetary policy before. And if memory serves, each time something bad happened in the markets, the Fed tended to backpedal on their plans and return to the "friend" zone. So, with stocks in free fall mode, will Powell really continue to "talk tough" during this week's presser? Or will there be some friendly hedging of words? Stay tuned!
My next question is, can earnings save the day? Don't forget that many of the market's most important names in the stock market are reporting shortly. While I have no idea what the big boys are going to say about the state of their business, I do hold out the possibility that earnings may be "just fine, thank you." And maybe, just maybe, this might be able to flip the script on the current doom and gloom outlook. Remember, I did say, maybe. We shall see.
But for now, the current violent dance to the downside is Exhibit A in my argument for including at least some degree of risk management into one's overall portfolio strategy. Nobody knows what will happen next, but for me, it is good to know that there are risk mitigation strategies in place in most portfolios I run.
Now let's review the "state of the market" through the lens of our market models...
The Big-Picture Market Models
We start with six of our favorite long-term market models. These models are designed to help determine the "state" of the overall market.
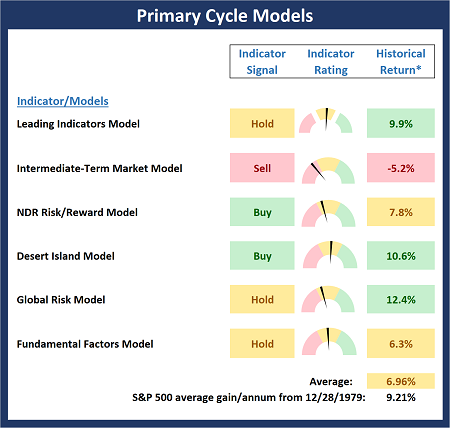
* Source: Ned Davis Research (NDR) as of the date of publication. Historical returns are hypothetical average annual performances calculated by NDR.
Current Take: Big Picture Models
There are two changes to the Primary Cycle Board to report this week. One bad, one good. First, Leading Indicators Model, which flashed a Sell signal last week, moved back up into the neutral zone this week. Although this is NOT the same as producing a Buy signal, it is a modestly hopeful sign in an otherwise dour environment. Next, our Intermediate-Term Market Model moved to negative. This is a model comprised of a broad array of technical indicators spread across all three major timeframes. As such, the weight of the technical evidence is now negative.
The Fundamental Backdrop
Next, we review the market's fundamental factors including interest rates, the economy, earnings, inflation, and valuations.
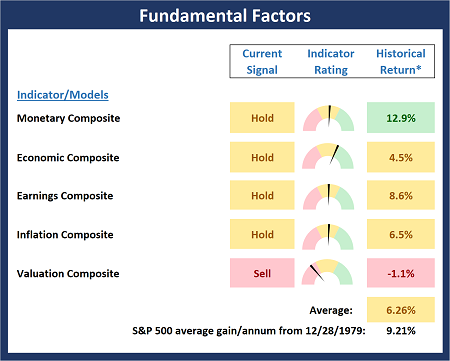
* Source: Ned Davis Research (NDR) as of the date of publication. Historical returns are hypothetical average annual performances calculated by NDR.
Current Take: Fundamental Models
There are no changes to the Fundamental Board this week. Note that this board has been suggesting for some time that this was NOT a low-risk environment. Thus, it is not surprising to see a more spirited selloff now that a selling catalyst has come out of the woodwork.
The State of the Trend
After reviewing the big-picture models and the fundamental backdrop, I like to look at the state of the current trend. This board of indicators is designed to tell us about the overall technical health of the market's trend.
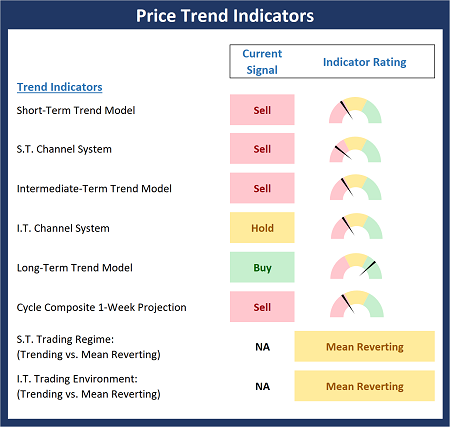
Current Take: Trend Models
The Trend Board continues to deteriorate and is now negative on balance. And if last week's violent dance to the downside wasn't indication enough, the Trend board makes it clear. The trend is now down. And while an oversold bounce is quickly becoming due, the bulls will have to reverse some of the damage on this board in order to be taken seriously.
The State of Internal Momentum
Next, we analyze the momentum indicators/models to determine if there is any "oomph" behind the current move.
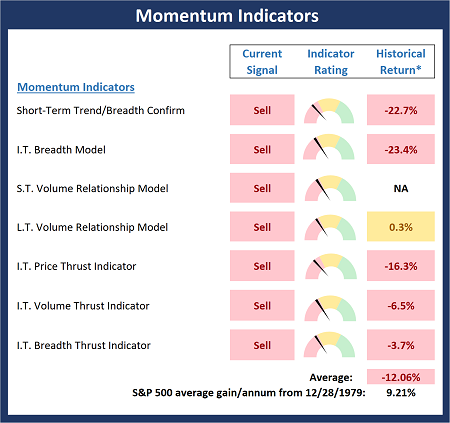
* Source: Ned Davis Research (NDR) as of the date of publication. Historical returns are hypothetical average annual performances calculated by NDR.
Current Take: Momentum Models
The Momentum Board did a good job in providing a warning that things were going to get worse. And worse they got. So much so that the board is now completely red. For me, this is an indication that (a) things have become overdone in the near-term and (b) the bottoming process may take some time.
Early Warning Indicators
Finally, we look at our early warning indicators to gauge the potential for countertrend moves. This batch of indicators is designed to suggest when the table is set for the trend to "go the other way."
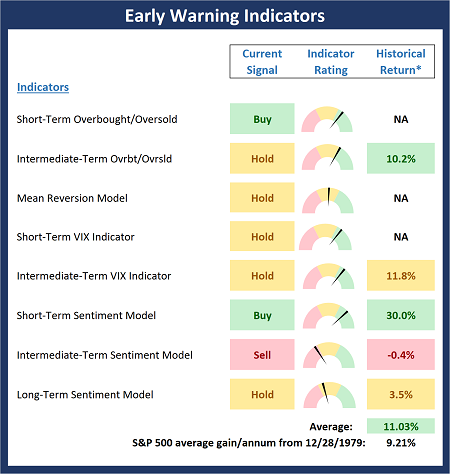
* Source: Ned Davis Research (NDR) as of the date of publication. Historical returns are hypothetical average annual performances calculated by NDR.
Current Take: Early Warning Models
Although the Early Warning Board is improving, it is far from what I'd call a "table pounding" mode. This suggests that while a bounce is likely in the near-term, the recent lows may be tested or even exceeded before a new uptrend can be established.
Thought for the Day:
Keep calm and carry on. -Winston Churchill
Wishing you green screens and all the best for a great day,

David D. Moenning
Founder, Chief Investment Officer
Heritage Capital Research, a Registered Investment Advisor

Disclosures
At the time of publication, Mr. Moenning held long positions in the following securities mentioned: None - Note that positions may change at any time.
NOT INDIVIDUAL INVESTMENT ADVICE. IMPORTANT FURTHER DISCLOSURES