Understanding The Current Market Logic

Given the state of the COVID headlines, the ongoing fighting over additional economic stimulus, the prospect of higher taxes next year, and the potential for a contested election, one couldn't be blamed for a less than optimistic outlook toward the stock market. However, "market logic" isn't always completely logical. And sometimes, as the late Joe Granville was famous for saying, "If it's obvious it's obviously wrong."
Take the downbeat view related to a stimulus deal for example. Markets initially fretted that a deal for additional stimulus won't get done anytime soon due to the politics associated with the election. That makes sense, right? And since Jay Powell has been basically begging Congress to provide as much stimulus as possible so as to limit the downside in the economy, it is logical that stocks would struggle if a deal doesn't get done.
Yet, while a stimulus deal doesn't appear to be close, the S&P 500 is back to within a stone's throw of all-time highs. Logical? Maybe not.
However, David Kostin, Goldman Sachs' chief U.S. equity strategist cleared things up for me recently. Kostin argued that the macro outlook remains upbeat. Yes, he says that a Biden win will mean higher corporate taxes. But, he argues, there are a lot of positive offsets to the increased taxes. Frist, Kostin believes that a Biden win means that a larger stimulus deal is likely, which will be "additive to earnings." This alone, Kostin says, will overcome the higher tax rates (Kostin's team projects next year's S&P 500 EPS will be between $170 on the low end and $179 on the high end).
Next, there is the interest rate outlook. With Powell & Co. saying in no uncertain terms that rates are going to stay lower for longer, which historically has been positive fro stocks. As is the idea that corporate America will likely resume buying back stock next year and also increase dividends. Then when you toss in the idea that foreigners continue to pile into U.S. stocks, Kostin argues that we should maintain on optimistic stance toward the U.S. stock market from a big-picture standpoint.
Now let's check in on our Fundamental Factors indicator board...
The State of the Fundamental Models
There are no changes to the Fundamental Factors board again this week. To review, Monetary conditions remain positive and supportive, the economic composite is improving steadily, earnings remain negative but are starting to show signs of improvement, inflation is not a concern (a positive), and valuations remain at extremely high levels - but we know that this tends to occur when the economy starts to come out of recession. All in, my view is the board continues to favor the bulls from a big-picture, intermediate- to long-term standpoint.
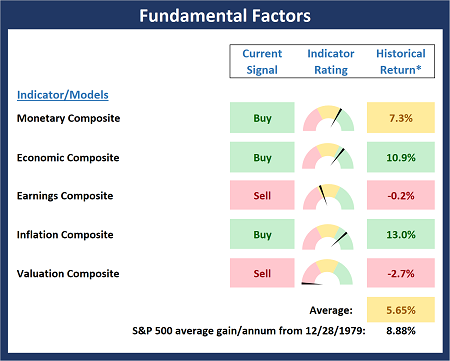
* Source: Ned Davis Research (NDR) as of the date of publication. Historical returns are hypothetical average annual performances calculated by NDR. Past performances do not guarantee future results or profitability - NOT INDIVIDUAL INVESTMENT ADVICE.
Thought For The Day:
If you don't like something, change it. If you can't change it, change your attitude. -Dr. Maya Angelou
Wishing you green screens and all the best for a great day,

David D. Moenning
Founder, Chief Investment Officer
Heritage Capital Research

Disclosures
At the time of publication, Mr. Moenning held long positions in the following securities mentioned: None - Note that positions may change at any time.
Fundamental Models Explained
Monetary Composite: The popular cliche, "Don't fight the Fed" is really a testament to the profound impact that interest rates and Fed policy have on the market. It is a proven fact that monetary conditions are one of the most powerful influences on the direction of stock prices. The Monetary Composite is a combination of two proprietary monetary models developed by Ned Davis Research. The first is comprised of 14 indicators and is plotted as a composite and the second is made up of eight monetary-related indicators including money supply, and the bond and commodities markets.
Economic Composite: During the middle of bull and bear markets, understanding the overall health of the economy and how it impacts the stock market is one of the few truly logical aspects of the stock market. The economic composite is a series of three models designed to indicate the current state of the economy.
Earnings Composite: A series of four models designed to indicate the overall health of corporate earnings. The first model is based on the slope of the smoothed S&P 500 earnings per share. The second model looks at the drivers of earnings and includes indicators such as U.S. industrial production, the CRB Spot Raw Industrial Material Price Index, the Treasury yield curve, Institute for Supply Management (ISM) indices, corporate bond credit spreads, unemployment claims, and the trend in analyst earnings estimate revisions for the S&P 500. The third model is designed to indicate the likely trend in the earnings per share reported for the S&P 500 Index. This model uses a variety of macro variables to indicate whether current conditions are favorable for strong, moderate, or weak growth in S&P 500 earnings. The fourth model the median 12-month percent change in the one-year analyst forecast out of the 500 components of the index.
Inflation Model: From an historical perspective, one of the best "big picture" indicators of what the market is expected to do next is inflation. The Inflation model is designed to identify cyclical changes in the rate of inflation. The model consists of 22 individual indicators primarily measuring various rates of change of such indicators as commodity prices, the Consumer Price Index (CPI), producer prices, and industrial production.
Valuation Composite: If you want to get analysts really riled up, you need only to begin a discussion of market valuation. While the question of whether stocks are overvalued or undervalued appears to be a simple one, the subject is actually extremely complex. The Valuation composite consists of five valuation indicators/models developed by Ned Davis Research. The first valuation indicator reviews the S&P 500 Price-to-Earnings GAAP Ratio relative to normal, expensive, and bargain valuation zones. The second model measures the S&P 500’s Median P/E ratio, representing the median P/E of the 500 stocks in the index. The third model measures the Median P/E ratio of a multi-cap stock index. The fourth indicator is the P/E ratio of the Value Line Index. The fifth model is a composite of 7 indicators designed to reflect stock market valuations based on how various valuation indicators compare to their latest 10-year historical ranges.
NOT INVESTMENT ADVICE. The opinions and forecasts expressed herein are those of Mr. David Moenning and Heritage Capital Research and may not actually come to pass. The opinions and viewpoints regarding the future of the markets should not be construed as recommendations. The analysis and information in this report is for informational purposes only. No part of the material presented in this report is intended as an investment recommendation or investment advice. Neither the information nor any opinion expressed constitutes a solicitation to purchase or sell securities or any investment program.
Any investment decisions must in all cases be made by the reader or by his or her investment adviser. Do NOT ever purchase any security without doing sufficient research. There is no guarantee that the investment objectives outlined will actually come to pass. All opinions expressed herein are subject to change without notice. Neither the editor, employees, nor any of their affiliates shall have any liability for any loss sustained by anyone who has relied on the information provided.
Mr. Moenning of Heritage Capital Research is an investment adviser representative of Eastsound Capital Advisors, LLC, a registered investment advisor. The adviser may not transact business in states where it is not appropriately registered, excluded or exempted from registration. Individualized responses to persons that involve either the effecting of transaction in securities, or the rendering of personalized investment advice for compensation, will not be made without registration or exemption.
Mr. Moenning and Heritage Capital Research may at times have positions in the securities referred to and may make purchases or sales of these securities while publications are in circulation. Positions may change at any time.
The analysis provided is based on both technical and fundamental research and is provided "as is" without warranty of any kind, either expressed or implied. Although the information contained is derived from sources which are believed to be reliable, they cannot be guaranteed.
The author neither endorses nor warrants the content of this site, any embedded advertisement, or any linked resource. The author or his managed funds may hold either long or short positions in the referenced securities. Republication rights must be expressly granted by author in writing.
Investments in equities carry an inherent element of risk including the potential for significant loss of principal. Past performance is not an indication of future results.