What Could Go Wrong?
My friend/colleague Mr. Jeff Pietsch, CFA, and I were asked last week to offer our thoughts on the reasons why the U.S. stock market could experience a correction in the coming weeks/months ahead. It was a good exercise as it is a really good idea to look at the game from both teams' perspective on occasion - and I thought it might be worth a read. So, without further ado, here are "eight reasons to expect a pullback - and one not to worry."
Eight Reasons to Expect a Market Pullback – And One Not to Worry
We continue to expect the COVID re-opening trade to carry forward throughout the better part of this year. Just Friday, the Bureau of Economic Analysis reported that first-quarter Growth Domestic Product ("GDP") grew at an annual rate +6.4%. In addition, manufacturing and service indices are the strongest they have been in nearly forty years, corporate earnings continue to surprise to the upside, and a multi-year national infrastructure plan is in the works.
However, as we sit one-full year from the pandemic lows, and after a historic rebound, we continue to be on the lookout out for any potential change in market character or investor sentiment. After all, as a tactical investing proponent, it is our goal to preserve client capital as much as it is to grow it. In that vein, here are eight reasons why a market pullback may be due… And one reason not to worry!
1. Stock Valuations Are Lofty
The total return adjusted stock Price/Earnings ratio for the S&P 500 is now above 38 on the global economic re-opening. Although not quite at pre-tech 2000 bubble levels, this leaves valuations in their 98th historical percentile, placing continued growth and contained inflation under the microscope each quarter ahead.
Looking at the broad market, the story is similar. Below is a chart of the P/E ratio of the Value Line Index back to 1980, which, as you can see, is at extremely high levels.

Source: Ned Davis Research Group
In addition, other metrics, such as the Price-to-Sales ratio (chart below) also suggests valuations are at extreme levels.

Source: Ned Davis Research Group
To be sure, valuations can remain elevated for quite some time, as seen in 2004-2007 in the first chart above. However, we feel it is important to recognize that the overvalued condition seen in the market, which is evident across nearly all traditional metrics, suggests that market risk is elevated at the present time. And although overvaluation is most definitely not a signal that a correction is imminent, it does tell us to be cognizant of the risk/reward environment.
2. Earnings Comps Will Get Tougher
As we have stated, markets have made a historic recovery since the lockdowns have lifted. However, at some point in the months ahead, the year-over-year earnings comparisons, which are currently well above expectations, will become much more difficult to match. The market is ultimately a forward discounting mechanism, and with stocks arguably "priced to perfection," any disappointment on the earnings front would be certain to catch investors’ eyes.
3. VIX Levels Suggest an Unprepared Market
CBOE Volatility Index ("VIX") levels are well below twenty now. While this feeds into our long-term forecast for market stability, it likewise signals that market participants may not be prepared for any unexpected news flow. We all know that, ultimately, markets can "correct" with or without a "trigger." However, on top of any possible unforeseen black swan event, we continue to face the very real possibilities of a rise in Covid rates here or abroad (see the dramatic surge in cases in India), and/or a resumption of the march higher in long-term interest rates. Yes, these are known risks, but it seems to us markets have been lulled into a sense of complacency by the incredible post-election momentum, and we simply are not out of the woods just yet!
4. The Market Has Had At Least One 6.5% Pullback Each Year Since 2000
That is right, a 5% to 10% retrace in the S&P 500 index at least once per year is very normal, and in fact, we have seen one such "pullback" each year over the past twenty. The surprise here would be if we do not see the bears come out of hibernation – even for a short period – sometime in 2021.
5. Seasonal Tailwinds Will Become Headwinds
Many of you are likely familiar with the "Sell in May" effect. Yes, it is real; historically, May 1st through October 31st represents the weaker half of the year for stock market performances. In addition, 2021 is the first year of a presidential cycle, which is often negative. While there has been a lot of hype over the infrastructure proposal, for instance, did you happen to take note of the embedded corporate and wealthy filer tax hikes? For the moment it is all hypothetical, but if those get closer to reality, it could certainly affect the tone of the market.
For example, below is a "mashup" of the historical One-Year, 4-Year Presidential, and Decennial cycles put together by Ned Davis Research Group. The blue line is the cycle composite’s projected market pattern for 2021 and the dashed orange line is the actual movement of the S&P 500.
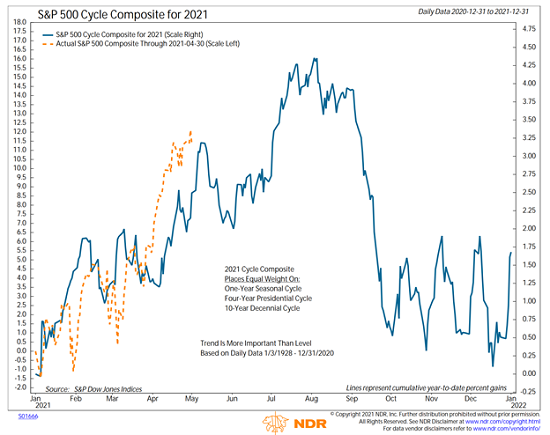
Source: Ned Davis Research Group
While the market does not always follow history or repeat cycles exactly, we have found over the years that the historical patterns oftentimes "rhyme." Thus, the cycle "mashup" can be eerily good at projected what to expect over the course of any given year. And this year, the cycle projections call for a rather stiff pullback once the traditional "summer rally" runs its course.
6. Everyone Is on the Same Side of the Trade
Next is our largest concern for the moment – simply that we would be hard-pressed to find a professional that is not onboard with an optimistic outlook for US stocks. And when all market participants get on the same side of a consensus trade with stocks and bonds both as expensive as they are, it often ends poorly.
7. Inflation May Hotter than Expected - And Maybe Not Transitory
Don’t look now fans, but the prices of lots of "things" are moving up – in earnest. Exhibit A is the price of Lumber, which is now several times what it was at the end of last year. Next, we note that Copper recently hit its highest level in nearly 10 years. Home prices are gaining at the fastest rate in 15 years. On Friday, we learned that the Federal Reserve’s preferred measure of inflation (PCE – or Personal Consumption Expenditures) saw the biggest monthly gain since 2009. And the Employment Cost report displayed the best quarterly wage growth since 2001. And over the weekend, the Oracle of Omaha, Warren Buffett also acknowledged that his companies are seing inflation much higher than expected.
We feel the key here is that the Fed, and in turn, the current market narrative, expects the long-awaited rise in inflation to be temporary. But, many economists disagree, contending that the rise in costs will become more "sticky" going forward. As such, the Fed – and again, the markets – may be forced to deal with a different type of inflation "problem" in the future. As in too much inflation. Something that hasn’t seen in a very long time.
8. All Good Things Come to an End, Eventually
It is safe to say that the economic data and corporate earnings have been surprisingly strong so far in 2021. However, it is important to remember that both the federal government and the Federal Reserve have played a large role in "goosing" growth in order to move the economy up and out of the COVID-induced hole as fast as possible. The key point is that the current rate of growth for both the economy and earnings is likely unsustainable. Thus, at some point, the forward-looking stock market will have to deal with slowdowns on several fronts.
First, both economic and earnings growth should begin to slow as the global economy returns to some form of "normal." In addition, Jerome Powell’s Fed will have to return monetary policy to a more normal state, which, in this case, means "tapering" the current bond-buying program and raising rates. And it should be noted that all of the above has tended to create less-than favorable environs for the U.S. stock market.
But… Did We Mention the Economy Is Good?
We started this article talking up the economy, and this is where we will leave. Despite the myriad of reasons laid out as to why we should expect to see a garden-variety pullback in the weeks/months ahead, the second year of a bear market recovery generally continues to bring positive, if not more muted returns featuring modestly higher volatility. And so far at least, that is exactly where we are at.
All that said, as we also stated, we are market tacticians first and foremost. By being agile in selecting sectors, styles, and levels of exposure, our strategies are designed to dynamically adapt to whatever markets "cards" are dealt. And this, dear reader, is one key reason to not fret too much over the idea of a correction.
We Believe Risk Management Strategies Make Sense
While it has been popular to be a strategic buy-and-hold investor for many years now, the factors we have described above suggest the time may soon be ripe to employ a more active, risk-managed approach to portfolio management. An approach that incorporates risk mitigation elements and strives to "lose less" during the times when the bears come to call at the corner of Broad and Wall.
One of the key assumptions we make is that, if given a choice, few investors would intentionally remain invested during severely negative market environments such as was seen in 2000-2002, 2008, and again during the COVID Crash seen last spring. And it for this reason that we are proponents of a tactical, risk-managed approach to portfolio management.
In closing, while there are any number of reasons to expect the market to pull back and/or correct in the near-term, employing a risk managed approach to at least a portion of one’s portfolio provides investors a very good reason not to worry about corrections in the stock market.
Here's hoping you have a great week. Now let's turn to our weekly model update...
The Big-Picture Market Models
We start with six of our favorite long-term market models. These models are designed to help determine the "state" of the overall market.
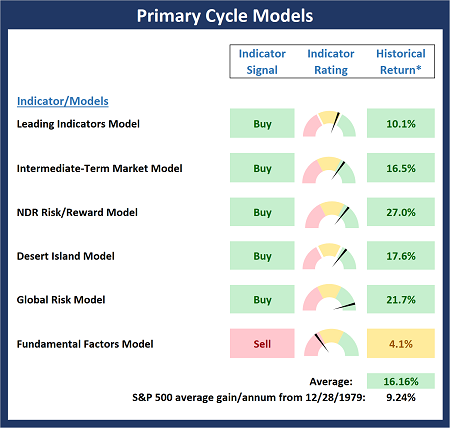
* Source: Ned Davis Research (NDR) as of the date of publication. Historical returns are hypothetical average annual performances calculated by NDR.
The Fundamental Backdrop
Next, we review the market's fundamental factors including interest rates, the economy, earnings, inflation, and valuations.
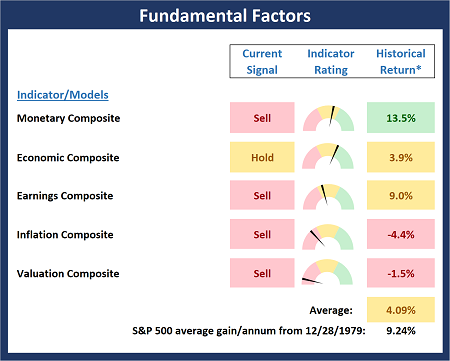
* Source: Ned Davis Research (NDR) as of the date of publication. Historical returns are hypothetical average annual performances calculated by NDR.
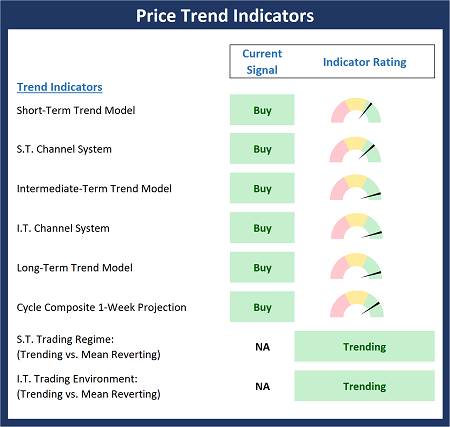
The State of the Trend
After reviewing the big-picture models and the fundamental backdrop, I like to look at the state of the current trend. This board of indicators is designed to tell us about the overall technical health of the market's trend.
The State of Internal Momentum
Next, we analyze the momentum indicators/models to determine if there is any "oomph" behind the current move.
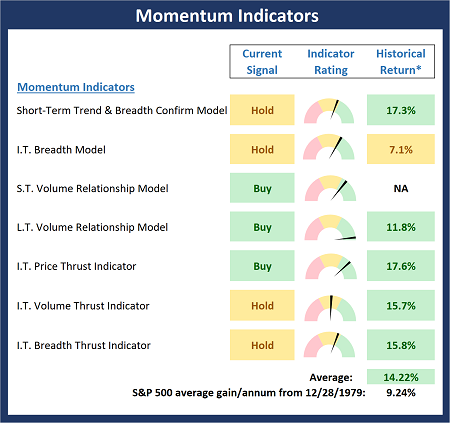
* Source: Ned Davis Research (NDR) as of the date of publication. Historical returns are hypothetical average annual performances calculated by NDR.
Early Warning Signals
Finally, we look at our early warning indicators to gauge the potential for counter-trend moves. This batch of indicators is designed to suggest when the table is set for the trend to "go the other way."
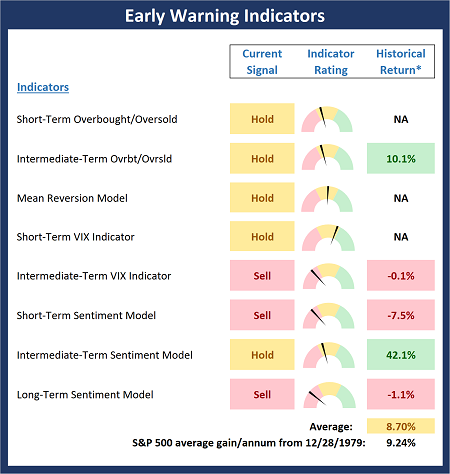
* Source: Ned Davis Research (NDR) as of the date of publication. Historical returns are hypothetical average annual performances calculated by NDR.
Thought for the Day:
True wealth is measured in lives you touch, not dollars you have. -Dan Duncan
Wishing you green screens and all the best for a great day,

David D. Moenning
Founder, Chief Investment Officer
Heritage Capital Research, a Registered Investment Advisor

Disclosures
At the time of publication, Mr. Moenning held long positions in the following securities mentioned: None - Note that positions may change at any time.
NOT INDIVIDUAL INVESTMENT ADVICE. IMPORTANT FURTHER DISCLOSURES