What Else Can Go Wrong?

To be sure, the action in the stock market has been a bit schizophrenic of late. Up one day, down the next, with no follow-through seen in either direction last week. As such, the key question in my mind is, where are we now?
From a very short-term perspective, it looks like Wall Street traders are entering the new week in an upbeat mood. The apparent reasoning for some green on the screen on this fine Monday morning is related to the improving situation in China. Here's a report from StreetAccount:
Improving China sentiment is the key focus this morning with updates around fewer Covid restrictions, regulatory easing, and stimulus. China reopening is a big driver to this morning's gains. China's worst Covid-19 outbreak is ending. Cases are falling, major cities are loosening restrictions and daily life is mostly returning to normal. Infections are trending down nationwide, thanks to ebbing cases in Shanghai and Beijing, which is opening up restaurants and cinemas.
After Friday's rather disappointing session, this morning's higher open provides some support to the idea that the current bounce might have legs. We shall see. For me, the keys will be the tape action (volume, breadth, and VIX) as well as the key price levels.
In short, if the S&P 500 can close above (and then stay above) last Wednesday's high (S&P 4177.51), then the bulls have a chance. Otherwise, a breakdown below 4074 would tell me the bears have won the day (again).
Moving beyond the near-term action, the question is if the recent rally, which began on May 20th, is just a bear market rally - or - the start of the next leg higher.
Given the macro backdrop, you know, the worst inflation spike in 40 years, an antagonistic Fed, a war in Europe, and slowing growth, it is kinda hard to get excited about the idea that a new bull market might be in the offing. Thus, the easy road here is to stay on the bear market rally bandwagon.
This actually makes some sense. While the bulls have been able to produce some momentum thrust signals recently, there has been a great deal of technical damage to the tape this year. And given all those macro negatives, it seems most managers are being cautious with their cash at this time. After all, nobody wants to buy here and then see a protracted bear play out - such as occurred in 2000-02 and 2008.
From a big picture perspective though, I don't see the latter playing out at this stage. From my seat, the market is currently in the process of digesting the recent gains as traders work toward pricing in Fed's current path to neutral (and likely a bit beyond) and an economic slowdown.
Yes, this is a process. But this is what bottoms and basing phases are all about - an ongoing "discussion/argument" between the bulls and bears, with neither team making a lot of headway for a while.
In this business, it is critical to employ a "two handed" approach to one's analysis. So... Let's spend a minute with our bear hat on. I think it is important to recognize that a recession is not likely baked into current prices and that megacap valuations are not in "cheap" zone. Therefore, the bears suggest that unless the economy slows enough for the Fed to back off, rates are going higher. Which, of course, is a problem for those big tech leaders.
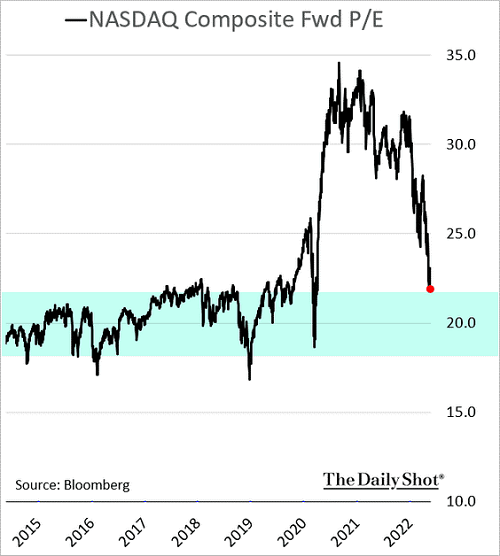
Image Source: The Daily Shot
Yet, at the same time, I'm reminded that in this business, one's goal should be to look on the bright side when there is blood in the streets and to be skeptical when everything is peachy keen, with no end to the joyride higher in sight.
What Else Can Go Wrong?
So, in the spirit of having an honest/open discussion here, I keep asking myself, can it not be argued that all the bad news is out? What more can go wrong?
Think about it; we've shut the economy down completely, then reopened it, creating all kinds of supply issues in the process. We told folks to do less so they wouldn't get seriously ill (creating pent-up demand along the way). We've got an unfathomable war occurring in Ukraine, which, is also creating supply problems. And we've got central bankers trying to fight inflation with their admittedly blunt tools, which has caused rates to surge.
Yet it is important to remember that if the Fed succeeds, the economy will slow. And what do interest rates do when the economy slows? Oh, that's right, they decline.
So I ask, how does this get worse? How does inflation get worse from here? How do rates go much higher than 3.25%?
I know, I know, tactical nukes. Stubbornly high inflation. More COVID. More supply chain problems. And the Fed making a mistake. Or, of course, something else entirely.
So, this is the "discussion/argument" I see taking place in the market right now. Who wins? I honestly don't know. But given everything that has occurred in the last couple of years, I'm actually impressed with how the S&P 500 and DJIA have held up.
Clearly this is because of the energy issues and some value plays in the venerable blue-chip indices. But the key (for me, anyway) is that unless things get worse, there is a chance that all the bad stuff is already out there.
Don't get me wrong. I'm NOT saying that we've seen the final lows. No, the bears could get the algos going again and another "whoosh" could certainly occur - for any number of reasons. But for the record, this is what "retests," which are typically part of the bottoming process, are all about.
So, while the "discussion" is likely to continue, and there is likely to be additional volatility, I, for one, think it is important to look at the bright side. Especially at times like these, it is critical to remember that good things can happen.
Now let's review the "state of the market" through the lens of our market models...
The Big-Picture Market Models
We start with six of our favorite long-term market models. These models are designed to help determine the "state" of the overall market.
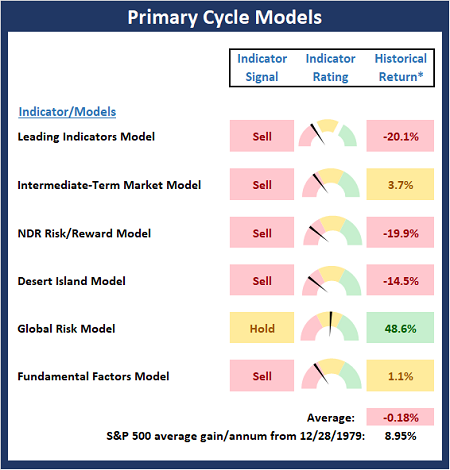
* Source: Ned Davis Research (NDR) as of the date of publication. Historical returns are hypothetical average annual performances calculated by NDR.
The Fundamental Backdrop
Next, we review the market's fundamental factors including interest rates, the economy, earnings, inflation, and valuations.
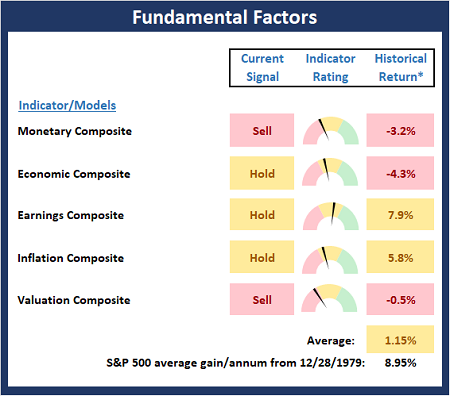
* Source: Ned Davis Research (NDR) as of the date of publication. Historical returns are hypothetical average annual performances calculated by NDR.
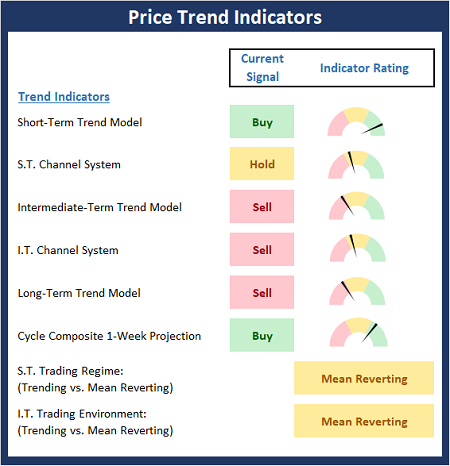
The State of the Trend
After reviewing the big-picture models and the fundamental backdrop, I like to look at the state of the current trend. This board of indicators is designed to tell us about the overall technical health of the market's trend.
The State of Internal Momentum
Next, we analyze the momentum indicators/models to determine if there is any "oomph" behind the current move.
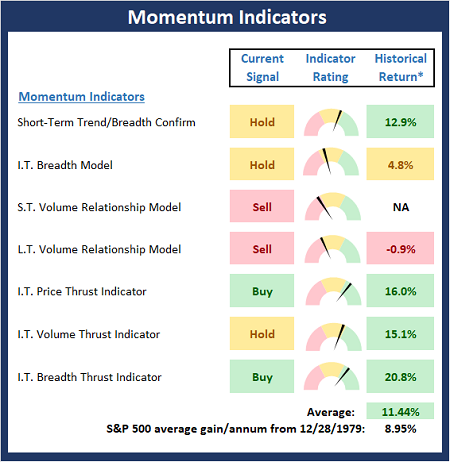
* Source: Ned Davis Research (NDR) as of the date of publication. Historical returns are hypothetical average annual performances calculated by NDR.
Early Warning Indicators
Finally, we look at our early warning indicators to gauge the potential for countertrend moves. This batch of indicators is designed to suggest when the table is set for the trend to "go the other way."
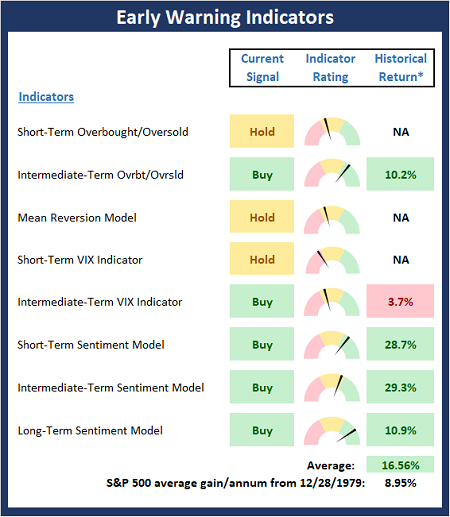
* Source: Ned Davis Research (NDR) as of the date of publication. Historical returns are hypothetical average annual performances calculated by NDR.
Thought for the Day:
Happiness depends upon ourselves -Aristotle
Wishing you green screens and all the best for a great day,

David D. Moenning
Founder, Chief Investment Officer
Heritage Capital Research, a Registered Investment Advisor

Disclosures
At the time of publication, Mr. Moenning held long positions in the following securities mentioned: None - Note that positions may change at any time.
NOT INDIVIDUAL INVESTMENT ADVICE. IMPORTANT FURTHER DISCLOSURES