What Will It Take?

Stocks are starting the week on a weak note, basically following the leads from Europe and China (where a shutdown in Macau seems to have ignited COVID fears again). However, it is worth noting on this fine summer morning that the "action" has been improving of late. As in, there weren't any sudden, violent declines that appeared out of nowhere last week. From my seat, last week's market wasn't half bad, and some will argue it was actually pretty good.
However, at this stage of the game, it is easy to be either (a) overly negative because things have been just plain bad for so long or (b) overly anxious for the next bull to begin. So, this morning I thought we would take a look at the arguments from both teams as well as what it might take for this bear market to end.
Let's start by reviewing the key points from our furry friends in the bear camp. Starting with the price action, those seeing the market's glass as at least half-empty remind us that the major indices are in confirmed downtrends. They point to the series of "lower highs" and "lower lows" on the charts since January and remind us that until this trend is broken, the path of least resistance is down.
Next up is the big macro worry - the state of the economy. Lest we forget, US GDP came in at -1.5% in Q1 and the current reading of the Atlanta Fed's GDPNow is -1.2%, which is up from the -1.9% reading on July 7th. And while two consecutive negative quarters of GDP growth is absolutely, positively NOT the definition of recession, it is the common definition tossed around in the financial press.
To be sure, the negative GDP prints are also NOT a surprise to anyone keeping a close eye on all things economic. No, as I've opined many times this year, last year's red-hot GDP prints were "juiced" by all the COVID-related stimulus from the Fed and Washington, and as such, were simply unsustainable. In short, a slowdown was inevitable.
The key here is to recognize that "slowing" GDP growth is NOT the same thing as "slow" growth - or worse yet, the cessation of the current growth cycle (which, is a much better definition of recession). And given that the best descriptor of current labor market continues to be "gangbusters," we need to keep all the negative talk about the economy in perspective.
However, there can be little argument that the economy is indeed slowing. The data is clear. Oh, and the futures markets are now pricing in rate CUTS for the first half of 2023. This, of course, leads to fears of what might happen between now and then.
Next is the collapse in crypto, which has old-timers worried about what is called "systemic risk." You know, the kind of risk that, according to Investopedia, "could trigger severe instability or collapse of an entire industry or economy." That certainly doesn't sound good.
The good news is that so far at least, the "crypto winter" has not spilled over or infected the global banking system - you know, the way the alphabet soup of securities did during the Great Financial Crisis.
The next big concern is another pillar of the stock market's support system - earnings. While analysts have been busy recently cutting consensus EPS left and right, the reductions have mainly been to the current quarter's numbers. The problem here is that consensus EPS estimates for Q3 and Q4 have barely budged. This leaves our furry friends to fret about these estimates remaining too high. And if this turns out to be the case, then some additional downside price exploration could be warranted. Super.
Other concerns expressed by the bear camp include dollar strength, Europe's natural gas problem, and China.
On the dollar front, the greenback recently hit its highest level relative to a basket of other currencies in 20 years due to what is generally referred to as a "flight to quality" on the back of global recession fears. Makes sense.
Looking at the bright side, perhaps the bulls' best argument right now is that market-based inflation expectations continue to improve. For example, at the beginning of January, the 5-year inflation rate expectation stood at 4.6%. By late April, that number had fallen to 3.6%. And as of last week, it stood at 2.8%. Although the reading is still above the Fed's stated target of 2%, it IS improving and isn't really "hot" enough to warrant extreme measures by the Fed.
The bottom line here is that while everyone on the planet expects Powell & Co to hike rates another 75 basis points this month, it can be argued that an end to the "front loaded" hiking campaign could be on the horizon.
Along these lines, it is important to note that commodity prices, which, of course, are big inputs in inflation calculations, have come down - rather dramatically of late. As of last week, Gasoline futures had fallen 22% from their January highs. Commercial metals (including "Doctor Copper") are down. Oil is down, etc. Why? Yep, you guessed it; economic growth/recession fears.
These growth fears are also reflected in the bond market. While the yield on the 10-year was surging to new cycle highs in mid-June, it has since pulled back and remains under 3% this morning.
Although it may be hard to understand why this action in bonds might be a positive, the idea is that the markets are doing a lot of the Fed's work for them. As such, inflation is likely to continue to come down. And here's the good part, inflation is likely to come down before the Fed is forced to don their Volcker hats and wreck the economy in the process. So, anything that keeps the economy out of the dumpster can be taken as a positive.
Which brings me to the big question: What will it take to push the bears back into hibernation? From my seat, it's a couple things, really. First and foremost, Ms. Market is looking for clarity on what is being called the Fed's "Terminal point." I.E. When the Fed can, at the very least, push pause on the hiking campaign.
At this stage, the futures markets are predicting the high point to Fed Funds over the next year will be 3.55%. This would mean that the Fed is currently about halfway home. And another 75 bp hike in July will put them around 1% from that endpoint. So, the bulls argue that they can soon start looking ahead.
In addition, markets will be trying to discern the future growth rate of both the economy and earnings. Remember, stocks look forward, not back. As such, if investors can become confident that the slowdown won't be horrific, then they can look ahead to brighter days. At some point.
The key here is this whole process of figuring out what the future looks like is likely to take some time. Thus, I'd expect to see a period of back-and-forth action as the argument/discounting continues. On the charts, this is likely to become a "basing phase."
Of course, I have no idea when this basing phase will begin or end. It could be starting now. Or not. But the key is I have a hard time seeing how this becomes a V-Bottom type of episode. So, at the very least, some patience is likely going to be needed in the coming months.
Now let's review the "state of the market" through the lens of our market models...
The Big-Picture Market Models
We start with six of our favorite long-term market models. These models are designed to help determine the "state" of the overall market.

* Source: Ned Davis Research (NDR) as of the date of publication. Historical returns are hypothetical average annual performances calculated by NDR.
The Fundamental Backdrop
Next, we review the market's fundamental factors including interest rates, the economy, earnings, inflation, and valuations.
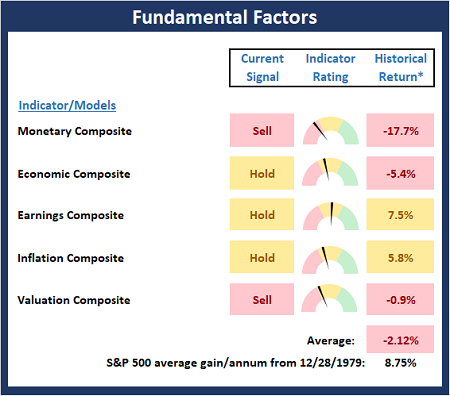
* Source: Ned Davis Research (NDR) as of the date of publication. Historical returns are hypothetical average annual performances calculated by NDR.
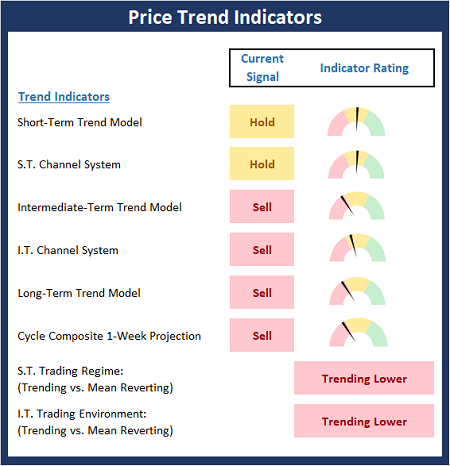
The State of the Trend
After reviewing the big-picture models and the fundamental backdrop, I like to look at the state of the current trend. This board of indicators is designed to tell us about the overall technical health of the market's trend.
The State of Internal Momentum
Next, we analyze the momentum indicators/models to determine if there is any "oomph" behind the current move.

* Source: Ned Davis Research (NDR) as of the date of publication. Historical returns are hypothetical average annual performances calculated by NDR.
Early Warning Indicators
Finally, we look at our early warning indicators to gauge the potential for countertrend moves. This batch of indicators is designed to suggest when the table is set for the trend to "go the other way."
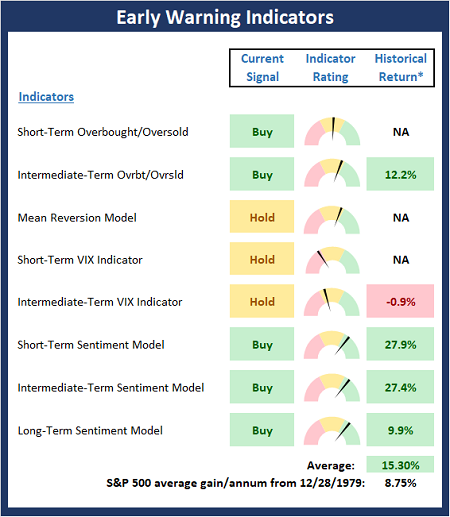
* Source: Ned Davis Research (NDR) as of the date of publication. Historical returns are hypothetical average annual performances calculated by NDR.
Thought for the Day:
The harder you work, the luckier you get. -Gary Player
Wishing you green screens and all the best for a great day,

David D. Moenning
Founder, Chief Investment Officer
Heritage Capital Research, a Registered Investment Advisor

Disclosures
At the time of publication, Mr. Moenning held long positions in the following securities mentioned: None - Note that positions may change at any time.
NOT INDIVIDUAL INVESTMENT ADVICE. IMPORTANT FURTHER DISCLOSURES