What's Next?

Stocks didn't make much progress again last week and appear to remain trapped in a consolidation phase. While the S&P 500 did manage to eke out a gain, none of the major indices were able to break out of their respective trading ranges.
The sideways action seems to be driven by the conflicting themes in the market. On one hand, you've got impressive year-over-year progress on both the economic and earnings fronts. Yet on the other hand, traders are being forced to deal with "taper talk," concerns about inflation, and the unavoidable slowdown that will undoubtedly occur based on the comparisons moving forward.
Speaking of slowdowns, the market has received a fair amount of data suggesting just that recently. For example, on Monday, the Chicago Fed National Activity Index experienced a pretty big miss, falling to 0.24 from 1.71. On Tuesday, we learned that New Home sales fell 5.9% in April and March's numbers were revised downward. Thursday saw Durable Goods fall 1.3% in April (the first decline in a year) and Pending Home Sales were down 4.4%.
When you combine these reports with the recent slowdown seen in Retail Sales, the weaker-than expected payroll numbers, and the problems in Industrial Production, well, it's hard not to argue that the economy is experiencing a loss of momentum.
Sure, this week's Nonfarm Payroll numbers could change the mood. Yes, it is easy to explain away the declines in home sales (lack of supply and increase in prices) and Industrial Production (supply chain interruptions). And I certainly "get" that Retail Sales couldn't continue at the recent stimulus-induced pace. But still, we must recognize the rate of change for many areas of the economy was simply unsustainable. And the recent reports seem to confirm this.
Yet there can be no arguing that the economy is "good" (as in, really good) right now and that things look bright going forward. For example, I saw a report last week from Morgan Stanley showing that Americans currently have $2 Trillion more in cash than they did pre-pandemic. Talk about the pent-up demand!
What Comes Next?
So, what should we expect next? Where do we go the rest of the year?
While long-time readers know that I don't manage money based on market calls, views, or projections, I do like to keep an eye on the historical cycles for clues as to what might be coming down the pike.
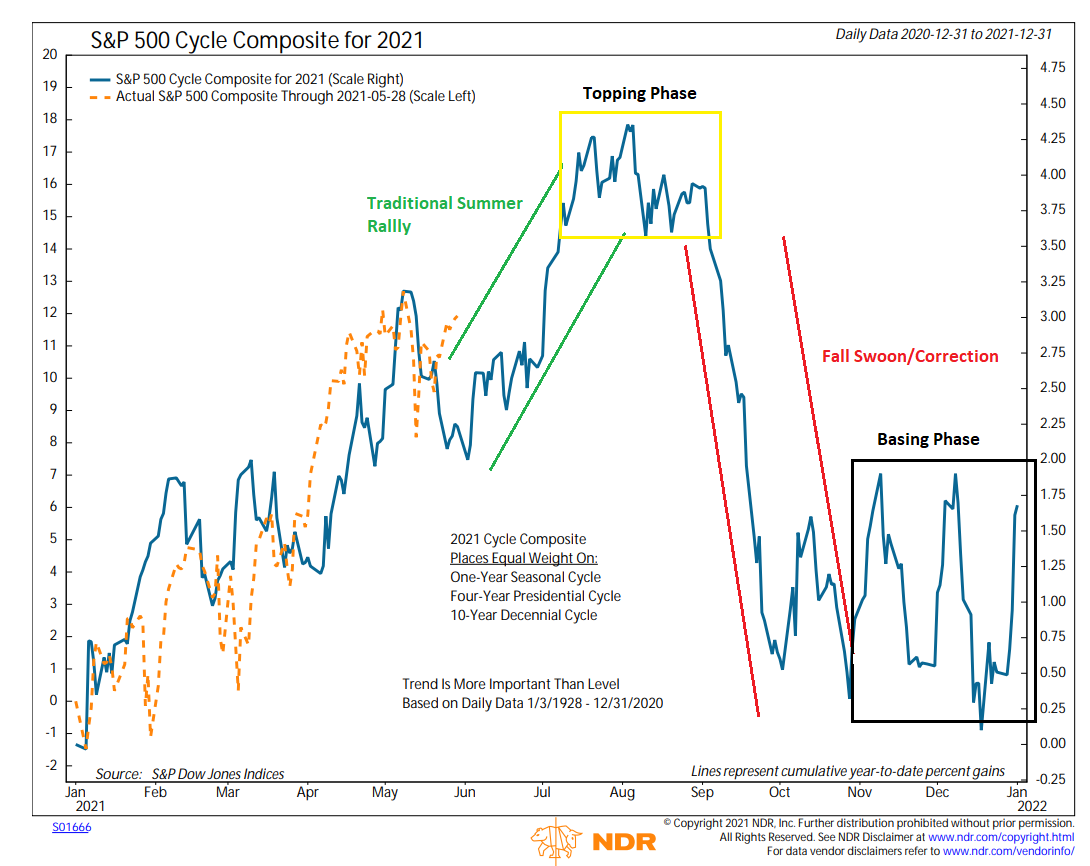
Below is a composite of four historical cycles, developed by Ned Davis Research Group. Their "Cycle Composite" blends together all the one-year seasonal, four-year Presidential, and ten-year decennial cycles going all the way back to early 1928.
As I've stated a time or two in the past, the cycle projection is often good at projecting the general trends of the market - and at times, the projections can be scary good. Although, there are also times when the market doesn't follow the historical patterns at all (as in, not a lick) and stocks go their own way.
But what I've learned from watching the Cycle Composite on a daily basis for many years is that when the market is in sync with the cycles, the composite can provide a decent guide for the year.
So, let's get to it. Below is the Cycle Composite for 2021. The blue line is the Cycle Composite, and the dashed orange line is the actual movement of the S&P 500.

View Full Size Chart
* Source: Ned Davis Research
As you can see, the market appears to be largely in xync with the composite so far in 2021. And if things continue to unfold according to plan, we should expect to see another leg higher, which would be in keeping with the traditional summer rally. From a near-term standpoint, I can argue that stocks could move higher if traders can come to grips with their fears about Fed tapering and inflation.
The Fall Swoon
However, as we move into early fall, history says there could be trouble ahead.
The Cycle Composite suggests that stocks could experience a meaningful correction in the historically weak September through October period. And while the trend of the Cycle Composite is more important than the levels, the current projection suggests that 2021's year-to-date gains could come under fire.
For me then, the next question is, what could cause such a pullback? Why would stocks give up double-digit gains?
Potential Causes of a Correction
As usual, there are any number of reasons one could espouse here. Not the least of which is inflation becoming a problem. Just this week we learned that the Fed's preferred measure of inflation - the Core PCE (Personal Consumption Expenditures), grew by 3.1% year-over-year, which was the most since July 1992. And the monthly increase of 0.7% (which was above expectations) was the highest since October 2001.
Another area of concern could be interest rates. I can argue that yields have largely priced-in the current economic/inflation scenario. However, should inflation continue to "run hot" for longer than the consensus currently expects, we could easily see rates resume their rise. As former Dallas Fed President Richard Fisher said last week, "the direction of yields is higher," the only question is at what pace rates will rise.
What About Earnings?
Then there is the earnings picture. There can be no argument that earnings have come in well above expectations. And the bottom line is the current parade of corporate profits has been impressive. Yet, despite the really strong reports, stocks have largely yawned in response. This tells me that the good news was already "baked in" to prices.
Remember, stocks look forward - not back. The stock market is...everybody now... "A discounting mechanism of future expectations." So, the key to the future direction of stock prices could easily be earnings. As in, if earnings growth can continue once the uber-easy year-ago comparisons are removed.
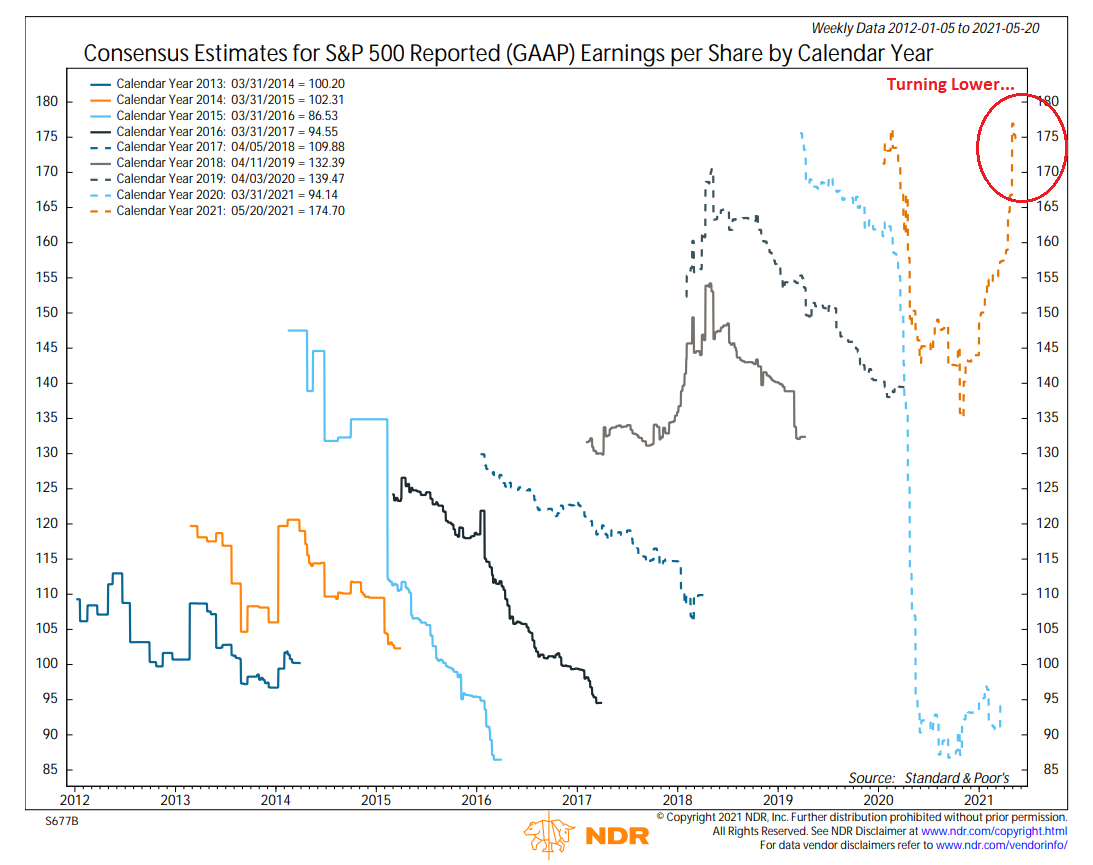
On that note, take a look at the chart below, which illustrates the Consensus Estimates for the S&P 500's GAAP (Generally Accepted Accounting Principles) earnings. The chart is updated weekly to illustrate how analyst estimates change over time.
I highlighted this chart in my May 10th report, which was titled, "A Chart That Makes Me Say, Wow!" At the time of the report, Consensus Estimates had surged from the $155 zone up over $175 in a very short period of time. A move, that did indeed make me say, wow.
But... Since then, analysts have started to trim their estimates. Although the decline from $177 to $174.70 isn't much to write home about and could easily be reversed in the coming weeks as analysts continue to adjust to the current reopening landscape, a further decline in expectations could certainly become problematic.

View Full Size Chart
* Source: Ned Davis Research
For example, IF (note the use of capital letters) Consensus Estimates continue to fall, valuations are likely to become an even bigger problem. The bulls argue that although traditional valuation metrics remain in nosebleed territory, the current pace of earnings growth will alleviate this situation over time. But if earnings don't continue apace, well...
Then IF inflation begins to look non-transitory, it is easy to argue that rates would likely start rising again - perhaps quickly. Which, of course, would also put pressure on multiples. And given the levels of stock market valuations, this combination COULD provide traders with enough to cause a "rethink" of expectations - and a correction in prices.
To be sure, I am NOT making a prediction here. Not about earnings, inflation, rates, and/or Fed expectations. No, I'm simply looking at what COULD possibly cause the stock market to rhyme with the projection of the Cycle Composite.
But, the optimist in me is hoping that the Cycle Composite has it completely wrong - and that stocks find a way to march merrily higher in a low volatility fashion for the remainder of the year. It could happen, right?
Publishing Note: I am traveling next week and will not publish a report.
Here's hoping you have a great week. Now let's turn to our weekly model update...
The Big-Picture Market Models
We start with six of our favorite long-term market models. These models are designed to help determine the "state" of the overall market.
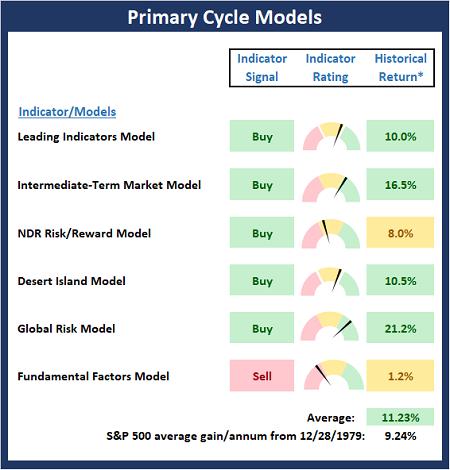
* Source: Ned Davis Research (NDR) as of the date of publication. Historical returns are hypothetical average annual performances calculated by NDR.
The Fundamental Backdrop
Next, we review the market's fundamental factors including interest rates, the economy, earnings, inflation, and valuations.
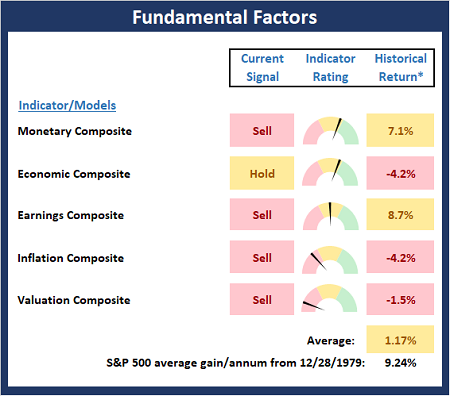
* Source: Ned Davis Research (NDR) as of the date of publication. Historical returns are hypothetical average annual performances calculated by NDR.
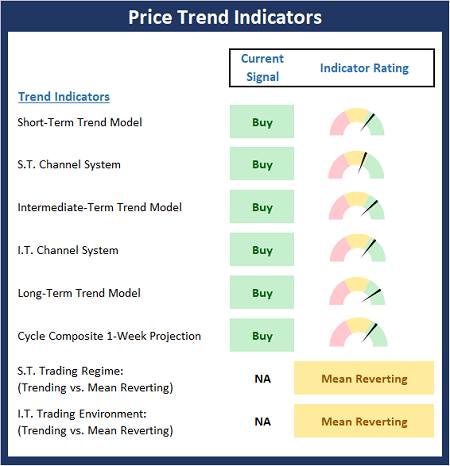
The State of the Trend
After reviewing the big-picture models and the fundamental backdrop, I like to look at the state of the current trend. This board of indicators is designed to tell us about the overall technical health of the market's trend.
The State of Internal Momentum
Next, we analyze the momentum indicators/models to determine if there is any "oomph" behind the current move.
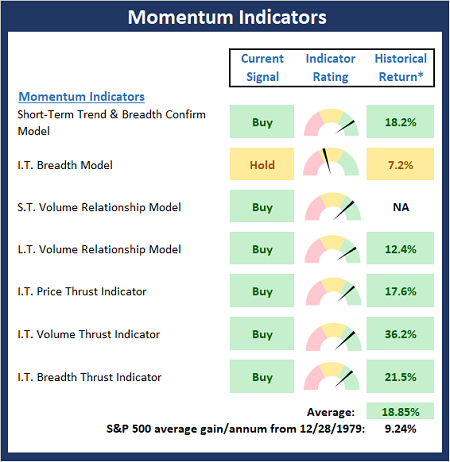
* Source: Ned Davis Research (NDR) as of the date of publication. Historical returns are hypothetical average annual performances calculated by NDR.
Early Warning Signals
Finally, we look at our early warning indicators to gauge the potential for counter-trend moves. This batch of indicators is designed to suggest when the table is set for the trend to "go the other way."
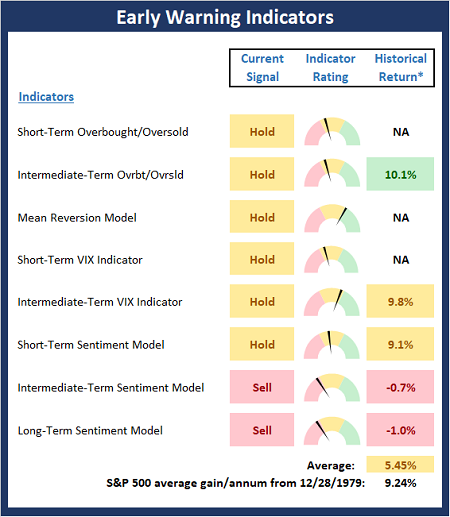
* Source: Ned Davis Research (NDR) as of the date of publication. Historical returns are hypothetical average annual performances calculated by NDR.
Thought for the Day:
Failure is the best teacher. -John Hagee
Wishing you green screens and all the best for a great day,

David D. Moenning
Founder, Chief Investment Officer
Heritage Capital Research, a Registered Investment Advisor

Disclosures
At the time of publication, Mr. Moenning held long positions in the following securities mentioned: None - Note that positions may change at any time.
NOT INDIVIDUAL INVESTMENT ADVICE. IMPORTANT FURTHER DISCLOSURES