Why I'm Not Worried About Valuations

One of the bear camp's main arguments is that stocks should be moving down instead of up because of high valuations. Our furry friends suggest that with traditional valuation metrics (Price-to-earnings/dividends/book value/sales, etc.) in the stratosphere, stocks simply have no upside. Then when you mix in the Delta variant spreading rapidly around the world, inflation surging, and the potential for rates to rise sooner rather than later, the bears can be heard telling anyone who will listen that now is the time to head for the hills.
But then again, this is the refrain that the bears sing most of the time. The glass is always half-empty. The sky is certainly about to fall. And there is no way this time can be different.
Except from my seat, this time IS different. The bottom line is never before has the global economy been shut down - intentionally - in response to a pandemic. Never before have supply chains been disrupted due to health issues. Never before has GDP and, in turn, corporate earnings, crashed and then rebounded with such velocity. And never before have investors seen the type of rebound in stock prices that last year's V-Bottom produced.
As such, it is easy to argue that stock prices may have gotten ahead of themselves. This idea certainly explains why big COVID winners such as Amazon.com (AMZN) needed to rest for a while. And rest it did as the company that changed the way we shop has moved sideways for the past 10 months or so. This price action tells us that price did get ahead of earnings.
The same argument can be applied across a broad swath of stocks, industries, and even factors. Traders latch onto a theme and then buy-buy-buy until the theme becomes overdone. Next, once somebody realizes that a company like Caterpillar (CAT) can only go up so much, the mean reversion trades begin. And then bam, you see a "correction" of 15% in a matter of days.
This is simply the way the game is being played right now. Embrace a theme. Get onboard. Overdo the theme. Employ the mean reversion trade. Rinse and repeat.
Some term such action a "rolling correction." This is where lots of stocks/industries/sectors/factors experience corrections, but since the money from the sales has to go somewhere - such as companies/industries/sectors/factors that have been pushed down too much on a relative basis - the S&P 500 marches merrily higher, albeit at a snail's pace.
And with the major indices seeming to defy logic - you know, prices are too high - the bears continue to pound the valuation drum.
But... History shows that in certain environments, valuations can get high and stay high for quite some time - as in years.
Take a peek at the chart below, which sports the S&P 500 on the top clip and the P/E Ratio of the Value Line on the bottom clip.

View Full Size Chart Online
Source: Ned Davis Research
On the left side of the chart, note that the P/E got "high" (approaching 20) and then stayed "high" as the economy recovered from the 2000-02 recession. This tends to happen to valuations after the economy experiences a recession. In short, this is because first the recession crushes the "E" (earnings). Then the "P" goes up as investors begin to discount the ultimate recovery, producing an elevated P/E Ratio in the process.
History is replete with examples of this phenomenon. As such, valuations "got high" and "stayed high" for more than four years - until things got out of hand and the Great Financial Crisis ensued. Which, of course, created the next cycle of elevated valuations.
After the 2008 debacle, it took investors many years to become confident that the economy would recover and eventually grow. (The never-ending Greek crises certainly didn't help and were likely to blame.) However, starting in/around 2013, stock prices marched steadily higher as investors looked ahead to better days. In turn, valuations "got high" and then "stayed high" for many years.
This time, the Earnings Recession created by 2015-16 oil crash ultimately ended this long stretch of high valuations as a cyclical or "mini-bear" market followed.
The next cycle looked to be taking hold in early 2020. As you can see, the P/E again started to reach high levels. But then COVID happened, and everything stopped. For a while, anyway.
With the economy completely shut down due to the pandemic, earnings crashed. As did stock prices - and, of course, P/E's.
But... As the world worked its way through COVID, investors began to realize that this was not your normal recession. No, this one was self-induced. And while businesses that depended on people being in tight quarters suffered mightily, many areas of the economy either weren't affected that much or even thrived.
So, investors flocked to the "COVID winners" trade. This eventually became "overdone" as everyone bombed into the same small universe of stocks. Then as the vaccination process began to take hold, investors realized that "normal" might be a thing again. Cue the "reopening trade." Which, of course, also became overdone in time.
As such, "rotational" trades have dominated the scene over the past year. Sell the stuff that's up a ton (see weekly charts of CAT and DE) and buy the stuff that's been out of favor. Again, this is the game right now.
But this also helps explain why valuations have remained high. The "ridiculously valued" companies get sold and the more attractive areas get bought. The end result is the overall market P/E remains elevated.
In addition, we need to recognize that earnings are now recovering - and fast. As the latest earnings parade illustrated, pent-up demand and consumers returning to some form of normal has been good for business. Thus, earnings have spiked, which has helped push the P/E's down a bit. (See the move down on the lower right side of the chart.)
To be clear, I am NOT saying that stocks are cheap. However, I AM saying that after recessions, it is normal for valuations to reach high levels. And if the economy continues to move ahead, valuations will ultimately become less extreme due to the corresponding improvement in earnings.
This is exactly what I see happening now. I believe an old cliche sums up the situation nicely here: Valuations don't matter until they do, and then they matter a lot. So, as long as the economy and corporate earnings continue to move ahead, I'm not worried about valuations. However, if something comes along to interrupt the growth story, well, that's a different kettle of fish!
Here's hoping you have a great week. Now let's review our indicator boards...
The Big-Picture Market Models
We start with six of our favorite long-term market models. These models are designed to help determine the "state" of the overall market.
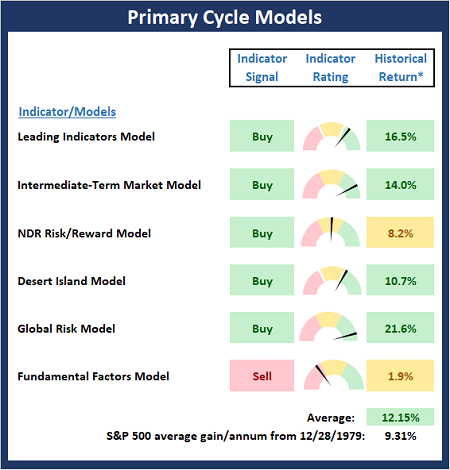
* Source: Ned Davis Research (NDR) as of the date of publication. Historical returns are hypothetical average annual performances calculated by NDR.
The Fundamental Backdrop
Next, we review the market's fundamental factors including interest rates, the economy, earnings, inflation, and valuations.
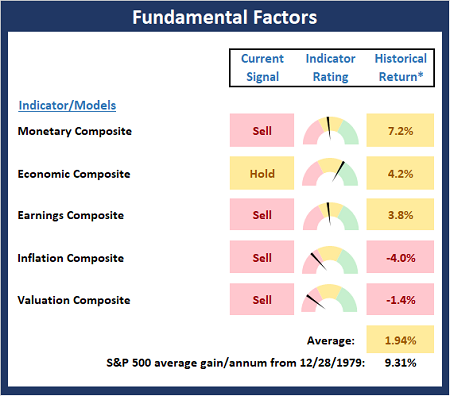
* Source: Ned Davis Research (NDR) as of the date of publication. Historical returns are hypothetical average annual performances calculated by NDR.
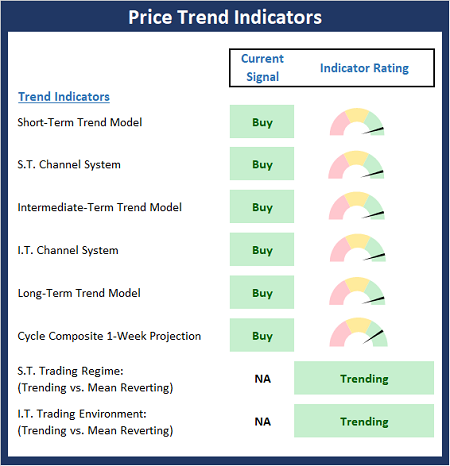
The State of the Trend
After reviewing the big-picture models and the fundamental backdrop, I like to look at the state of the current trend. This board of indicators is designed to tell us about the overall technical health of the market's trend.
The State of Internal Momentum
Next, we analyze the momentum indicators/models to determine if there is any "oomph" behind the current move.
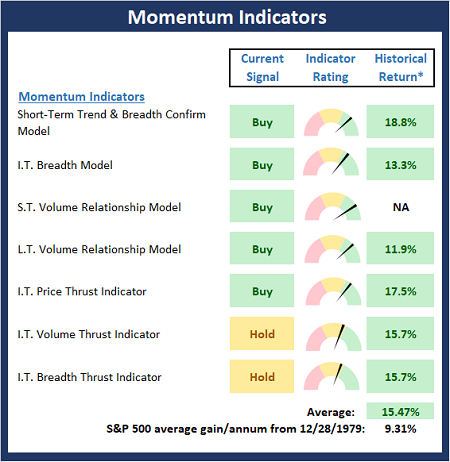
* Source: Ned Davis Research (NDR) as of the date of publication. Historical returns are hypothetical average annual performances calculated by NDR.
Early Warning Signals
Finally, we look at our early warning indicators to gauge the potential for counter-trend moves. This batch of indicators is designed to suggest when the table is set for the trend to "go the other way."
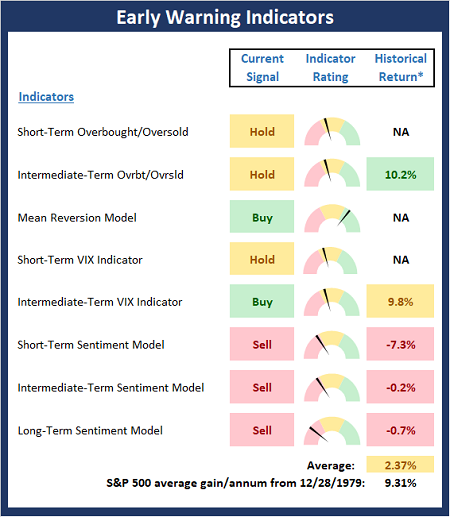
* Source: Ned Davis Research (NDR) as of the date of publication. Historical returns are hypothetical average annual performances calculated by NDR.
Thought for the Day:
When the power of love overcomes the love of power, the world will know peace. -Jimi Hendrix
Wishing you green screens and all the best for a great day,

David D. Moenning
Founder, Chief Investment Officer
Heritage Capital Research, a Registered Investment Advisor

Disclosures
At the time of publication, Mr. Moenning held long positions in the following securities mentioned: AMZN - Note that positions may change at any time.
NOT INDIVIDUAL INVESTMENT ADVICE. IMPORTANT FURTHER DISCLOSURES