You Knew It Was Coming, Right?
Before we get to the state of the market fundamentals, I figure it is probably a good idea to address the current violent selloff happening in the stock market.
First, the fact that the market suddenly fell, without notice, and on no news, should not come as ANY surprise to readers of this oftentimes meandering morning market missive. As I wrote on Wednesday, "The market continues to grind higher on a daily basis here and there has been little-to-no downside action since the end of June. And while I do believe we've got a "good overbought" condition on our hands, we have seen this movie before. If the market follows the script, we can expect a scary decline in response to whatever fear comes out of the woodwork next."
In addition, our Early Warning Board has been sending a "buyer beware" message for some time now. So, the question wasn't "if" the market would eventually sell off, but rather "when" and, of course, "why?"
What is interesting here is the "why" part. Because, in short, there was no "reason" for the megacap COVID-19 winners to suddenly get slammed. No headlines. No news on the virus. And no game-changing economic data. Nope, this computer driven selloff came out of nowhere.
Or did it?
While this is an extremely complex/geeky subject relating to the options market that few understand completely (including yours truly), it turns out that the relentless march higher in the megacap winners created a VERY one-sided trade in options and volatility. See the charts below illustrating (1) the massive call buying that took place in the general market and then (2) a chart of a similar idea for AAPL.
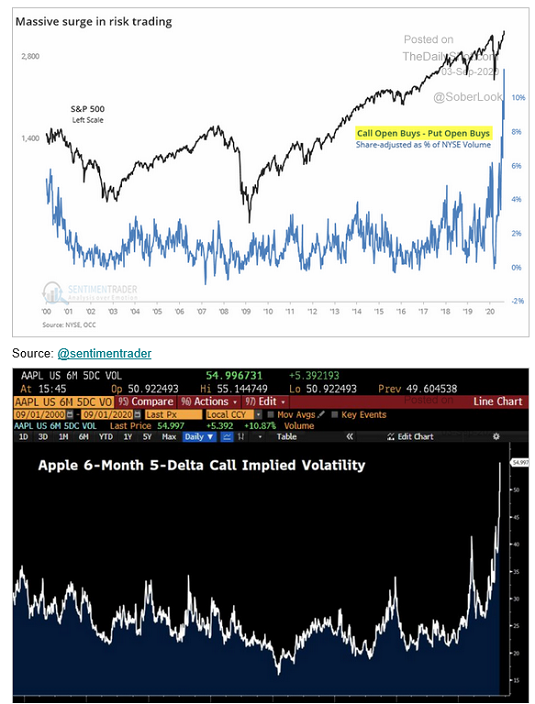
View Chart Online
Image Source: The Daily Shot
Cutting to the chase, it looks to me that the "unwind" of the speculative behavior (aka aggressive call options trading), which was likely triggered by options expiration, is creating what amounts to a version of "forced liquidations."
Sure, profit taking is going on here as there are LOTS of profits to be had in the megacap COVID winners. Heck, even I "right-sized" my position in AAPL last week by taking some profits due to the fact that the percentage holding in the portfolio had gotten out of hand. (And before that, we had used the joyride to the upside to rebalance our aggressive stock portfolio back to the target percentage holdings, thus "right-sizing" the positions into strength.)
When will it end, you ask? My guess is that the "unwind" part of this will take a few days and the "correction" part of this move, which was needed and "healthy" (as long as you've held the positions for a while) will last a week or two.
Could I be wrong on the timing? Yes, OF COURSE! But in my experience, I've found that having some idea of what to expect helps me keep my emotions in check, which tends to produce better decisions - especially when things appear to be falling apart at the seams.
Now let's get to the fundamentals...
Executive Summary on Market Fundamentals:
If you've been watching the economic data come in over the last three months, you have likely been a little surprised - in a good way - as the data have largely surprised to the upside. This is reflected in an uptick in our Economic Composite (see below), which turned green this week. As did our Monetary Composite. So, with the economy improving, the Fed committed to keeping rates low for longer than most expected, and additional stimulus money from Washington likely to occur at some point soon, the fundamental backdrop for stocks continues to look solid.
Things I'm watching include the moderation of said economic improvement, an uptick in inflation expectations (yes, really), the ongoing unemployment numbers, which remain staggering, and the stock market appearing to "pull forward" additional improvement that may or may not materialize. Fingers crossed!
The State of the Fundamental Models...
There are two positive changes to report on the Fundamental Factors board this week as both the Monetary and Economic Composites moved to green from yellow. I should also note that our Inflation Composite may be a bit too rosy at the present time. As I mentioned above, inflation expectations are on the rise (think about all the increased costs businesses face due to the pandemic and you'll get the picture) but don't yet show up in our Inflation Composite due to the fact that the indicators are only updated monthly. So, this remains something to watch. But for now, the Fundamental board has improved from largely neutral to largely positive.
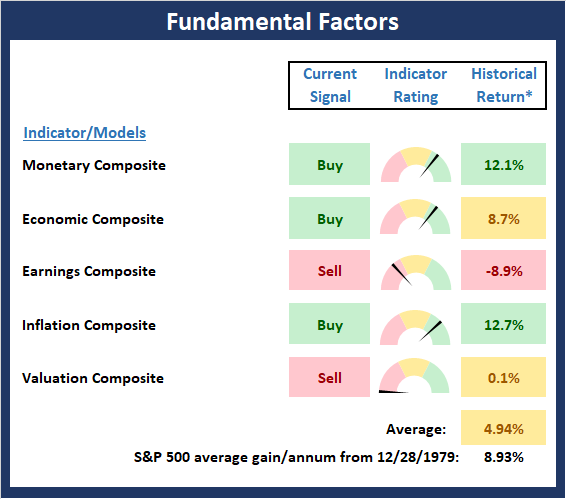
View Fundamental Indicator Board Online
* Source: Ned Davis Research (NDR) as of the date of publication. Historical returns are hypothetical average annual performances calculated by NDR. Past performances do not guarantee future results or profitability - NOT INDIVIDUAL INVESTMENT ADVICE.
The Word of the Day For The Economy is, "Moderation"
I mentioned above that one of the things I'm watching (besides the violent pullback in the market leaders, of course, which I currently view as "normal" given the joyride to the upside the market and many of the high profile names have enjoyed) is the trend of economic improvement.
Exhibit A for this issue arrived yesterday via the ISM Services report. The ISM Non-Manufacturing Index fell 1.2 points in August to 56.9, which was (a) a smidge below expectations for a reading of 57.0 and (b) still well above 50, which is the line of demarcation between growth and contraction. So, a reading of 56.9, while down from last month, is still pretty healthy.
It was also positive that 15 out of 18 services industries reported growth last month, which again, would appear to bode well for the future.
However, it is worth noting that the 1.2 point pullback in the Non-Manufacturing Index is consistent with other high-frequency data/indicators that show the economy has lost some momentum during the summer months. And with cooler weather ahead for much of the country, I worry about the general recovery of the services industry and the restaurant industry in particular.
From my seat, the trend of the economic recovery will be very important to monitor going forward. In short, while the recovery from the lock-down has occurred, I remain concerned about economic growth from here.
Thought For The Day:
Sometimes the biggest problem is in your head. You've got to believe. -Jack Nicklaus
Wishing you green screens and all the best for a great day,

David D. Moenning
Founder, Chief Investment Officer
Heritage Capital Research

Disclosures
At the time of publication, Mr. Moenning held long positions in the following securities mentioned: AAPL - Note that positions may change at any time.
Fundamental Models Explained
Monetary Composite: The popular cliche, "Don't fight the Fed" is really a testament to the profound impact that interest rates and Fed policy have on the market. It is a proven fact that monetary conditions are one of the most powerful influences on the direction of stock prices. The Monetary Composite is a combination of two proprietary monetary models developed by Ned Davis Research. The first is comprised of 14 indicators and is plotted as a composite and the second is made up of eight monetary-related indicators including money supply, and the bond and commodities markets.
Economic Composite: During the middle of bull and bear markets, understanding the overall health of the economy and how it impacts the stock market is one of the few truly logical aspects of the stock market. The economic composite is a series of three models designed to indicate the current state of the economy.
Earnings Composite: A series of four models designed to indicate the overall health of corporate earnings. The first model is based on the slope of the smoothed S&P 500 earnings per share. The second model looks at the drivers of earnings and includes indicators such as U.S. industrial production, the CRB Spot Raw Industrial Material Price Index, the Treasury yield curve, Institute for Supply Management (ISM) indices, corporate bond credit spreads, unemployment claims, and the trend in analyst earnings estimate revisions for the S&P 500. The third model is designed to indicate the likely trend in the earnings per share reported for the S&P 500 Index. This model uses a variety of macro variables to indicate whether current conditions are favorable for strong, moderate, or weak growth in S&P 500 earnings. The fourth model the median 12-month percent change in the one-year analyst forecast out of the 500 components of the index.
Inflation Model: From an historical perspective, one of the best "big picture" indicators of what the market is expected to do next is inflation. The Inflation model is designed to identify cyclical changes in the rate of inflation. The model consists of 22 individual indicators primarily measuring various rates of change of such indicators as commodity prices, the Consumer Price Index (CPI), producer prices, and industrial production.
Valuation Composite: If you want to get analysts really riled up, you need only to begin a discussion of market valuation. While the question of whether stocks are overvalued or undervalued appears to be a simple one, the subject is actually extremely complex. The Valuation composite consists of five valuation indicators/models developed by Ned Davis Research. The first valuation indicator reviews the S&P 500 Price-to-Earnings GAAP Ratio relative to normal, expensive, and bargain valuation zones. The second model measures the S&P 500’s Median P/E ratio, representing the median P/E of the 500 stocks in the index. The third model measures the Median P/E ratio of a multi-cap stock index. The fourth indicator is the P/E ratio of the Value Line Index. The fifth model is a composite of 7 indicators designed to reflect stock market valuations based on how various valuation indicators compare to their latest 10-year historical ranges.
NOT INVESTMENT ADVICE. The opinions and forecasts expressed herein are those of Mr. David Moenning and Heritage Capital Research and may not actually come to pass. The opinions and viewpoints regarding the future of the markets should not be construed as recommendations. The analysis and information in this report is for informational purposes only. No part of the material presented in this report is intended as an investment recommendation or investment advice. Neither the information nor any opinion expressed constitutes a solicitation to purchase or sell securities or any investment program.
Any investment decisions must in all cases be made by the reader or by his or her investment adviser. Do NOT ever purchase any security without doing sufficient research. There is no guarantee that the investment objectives outlined will actually come to pass. All opinions expressed herein are subject to change without notice. Neither the editor, employees, nor any of their affiliates shall have any liability for any loss sustained by anyone who has relied on the information provided.
Mr. Moenning of Heritage Capital Research is an investment adviser representative of Eastsound Capital Advisors, LLC, a registered investment advisor. The adviser may not transact business in states where it is not appropriately registered, excluded or exempted from registration. Individualized responses to persons that involve either the effecting of transaction in securities, or the rendering of personalized investment advice for compensation, will not be made without registration or exemption.
Mr. Moenning and Heritage Capital Research may at times have positions in the securities referred to and may make purchases or sales of these securities while publications are in circulation. Positions may change at any time.
The analysis provided is based on both technical and fundamental research and is provided "as is" without warranty of any kind, either expressed or implied. Although the information contained is derived from sources which are believed to be reliable, they cannot be guaranteed.
The author neither endorses nor warrants the content of this site, any embedded advertisement, or any linked resource. The author or his managed funds may hold either long or short positions in the referenced securities. Republication rights must be expressly granted by author in writing.
Investments in equities carry an inherent element of risk including the potential for significant loss of principal. Past performance is not an indication of future results.