Don't Look Now But Valuations Are Improving

My wife and I are supposed to be vacationing in England this week and next. But since COVID's Delta Variant (and the U.S. State Department) had other plans, my wife and are instead "staycationing" via a couple short trips. While the mountains of Colorado are very different from the Lake District of England and we don't get to spend time with our daughter, we are trying to make the best of it. So, the goal for this week and next are to enjoy the high country and play some golf in beautiful settings. As such, I'm trying to take some time away from the markets to recharge the batteries after an exceptionally busy first half of 2021.
However, there is a situation developing in the macro picture that I thought warranted a quick note this morning. As you are likely aware, one of the bear camp's major arguments is that stock market valuations are scary-high right now. And since we are likely seeing "peak everything" here, our furry friends suggest that there is only one way for stock prices to go from here - down.
I've written about valuations several times already this year, with the latest missive dated July 6, entitled "Why I'm Not Worried About Valuations".
My primary point was that the stock market's P/E ratio tends to rise - oftentimes dramatically so - as the country begins to exit a recession. The reason is simple math. Since the market is "a discounting mechanism of future expectations," stock tend to rally at the depths of a recession as traders begin to discount better days ahead. This occurs while the "E" in P/E continues to fall as a result of the economic slowdown. Thus, with "P" going up and "E" going down, you get elevated P/E ratios.
Typically, what happens next is earnings rebound as the recession ends and economic growth resumes. And as the economy normalizes after the interruption, the P/E Ratio does too. In short, this is why I'm not overly concerned about valuations at this point.
Yes, there are times such as 2000-2002 where sky-high valuations have been a problem. In this case, the popping of the tech bubble created the recession. Not the other way around. Prior to the tech trade unwinding, the economy had been just fine.
Granted, this cycle was completely different than anything we've seen in the past because the economy had never before been intentionally shut down and then reopened due to a pandemic. But my take is that the current situation is the opposite of what we saw in 2000 and more in line with the way valuations tend to act after recessions.
The "E" is Definitely Improving
Unless you've been living in a cave or don't spend your day with stock market machinations, you likely know that the current earnings parade has been stellar.
According to Deutsche Bank, with 296 of the S&P 500 companies reporting so far (or 71%), 88% have exceeded the consensus estimates - which is a record. And EPS has come in 16% above expectations, which is more than triple the average of 5% seen over the last 15 years. The chart below tells the story nicely.
Earnings "Beat" Rate - S&P 500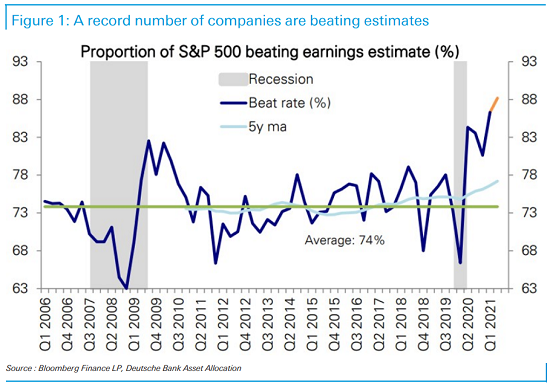
Image Source: Deutsche Bank
So... The P/E is Also Improving
With earnings surging at a record-breaking rate, the good news is that P/E ratios are starting to move lower. Below are a couple charts that make this point. First up is a broad market look via the P/E on the Value Line.
Value Line P/E Ratio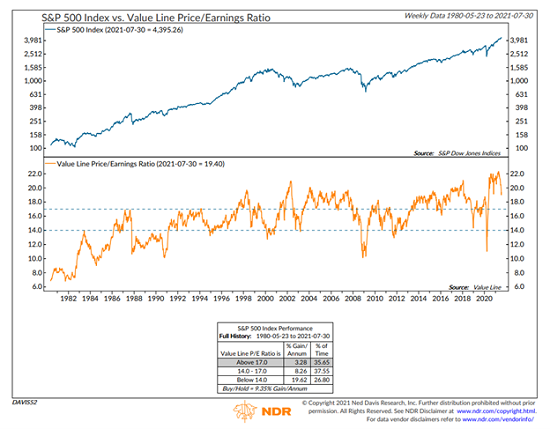
Image Source: Ned Davis Research Group
While I am not about to argue that the P/E low or that stocks are cheap, as this chart indicates, stocks can advance with P/E's at the current levels. And as long as the "E" continues to improve at a healthy clip and stock prices don't get overly exuberant going forward, the P/E Ratio can continue to move lower.
However, as the bears will quickly point out, a couple quarters of strong earnings doesn't mean the market is out of the woods. Below is a chart of the P/E of the Median stock in the S&P 500. This is designed to show the valuation of the median stock in the index - with half above and half below.
Median P/E Ratio - S&P 500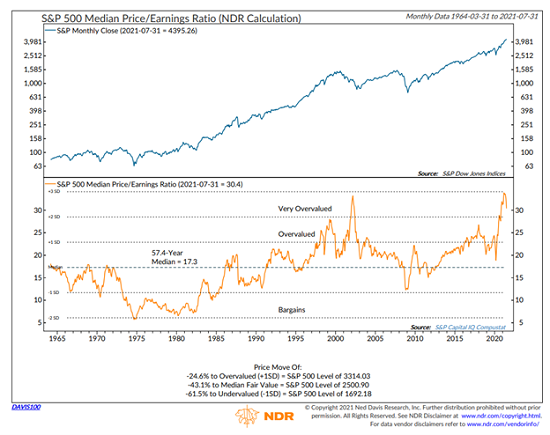
Image Source: Ned Davis Research Group
While this chart can still be placed in the "scary" category, the point is that the P/E has started to move lower.
But one can also argue that stocks are "priced for perfection" at this stage. And it is for this reason that I believe investors have to recognize that (a) risks remain elevated and (b) it may be necessary to play some defense in the near-term given the state of COVID and the historical cycles.
Here's hoping you have a great week. Now let's review our indicator boards...
The Big-Picture Market Models
We start with six of our favorite long-term market models. These models are designed to help determine the "state" of the overall market.
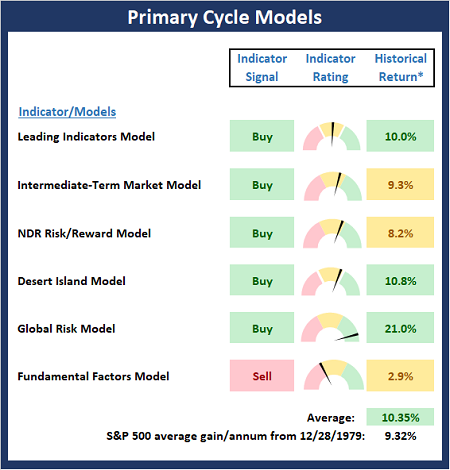
* Source: Ned Davis Research (NDR) as of the date of publication. Historical returns are hypothetical average annual performances calculated by NDR.
The Fundamental Backdrop
Next, we review the market's fundamental factors including interest rates, the economy, earnings, inflation, and valuations.
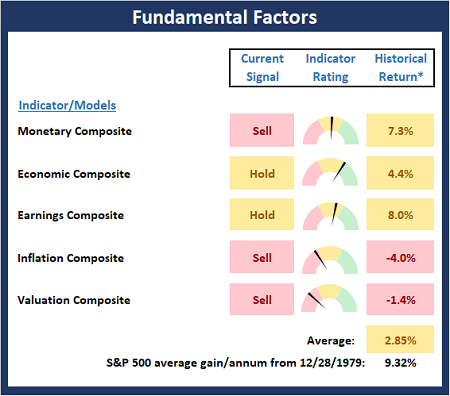
* Source: Ned Davis Research (NDR) as of the date of publication. Historical returns are hypothetical average annual performances calculated by NDR.
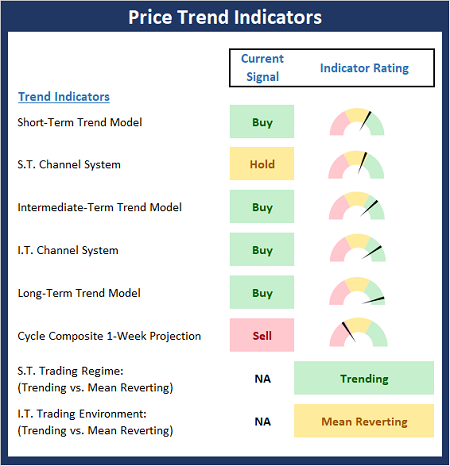
The State of the Trend
After reviewing the big-picture models and the fundamental backdrop, I like to look at the state of the current trend. This board of indicators is designed to tell us about the overall technical health of the market's trend.
The State of Internal Momentum
Next, we analyze the momentum indicators/models to determine if there is any "oomph" behind the current move.
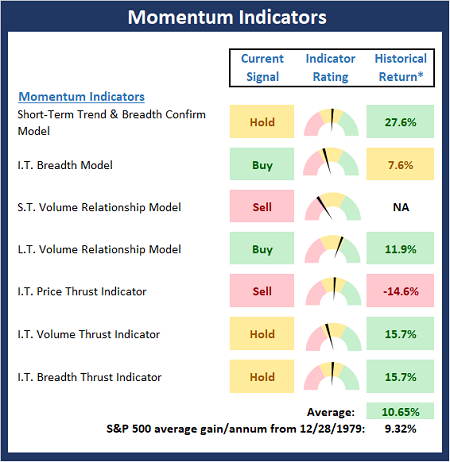
* Source: Ned Davis Research (NDR) as of the date of publication. Historical returns are hypothetical average annual performances calculated by NDR.
Early Warning Signals
Finally, we look at our early warning indicators to gauge the potential for counter-trend moves. This batch of indicators is designed to suggest when the table is set for the trend to "go the other way."
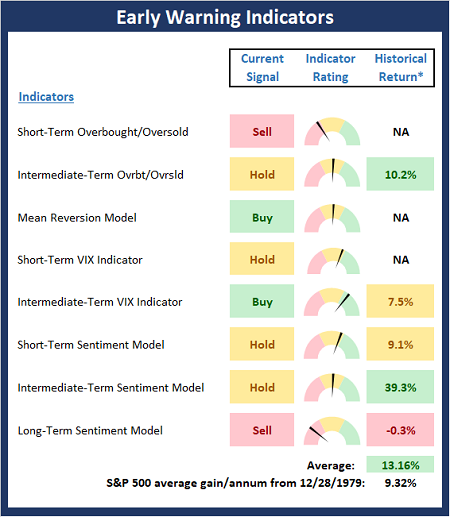
* Source: Ned Davis Research (NDR) as of the date of publication. Historical returns are hypothetical average annual performances calculated by NDR.
Thought for the Day:
Be kind to unkind people - they need it the most. - Unknown
Wishing you green screens and all the best for a great day,

David D. Moenning
Founder, Chief Investment Officer
Heritage Capital Research, a Registered Investment Advisor

Disclosures
At the time of publication, Mr. Moenning held long positions in the following securities mentioned: None - Note that positions may change at any time.
NOT INDIVIDUAL INVESTMENT ADVICE. IMPORTANT FURTHER DISCLOSURES