Party On Wayne?
Executive Summary:
In looking at the potential for a countertrend move to develop, the best way to summarize the situation might be to say, see last week's report entitled, "The Song Remains The Same." The bottom line is stocks remain overbought, sentiment has reached extremely positive levels, and complacency appears to have set in. As such, one can easily argue that the table is set for the bears to enjoy some time in the sun. However, since investors are currently looking ahead to better days, the news on the virus front has been improving, and earnings have been largely better than expected, a negative trigger will likely be required to get any real downside action going. But... If/when that trigger materializes, the extreme overbought condition could easily lead to a "whoosh" lower. But until then the battle cry appears to be, "Party on Wayne!"
My Review Process: I believe one of the keys to longevity in the investing business is having a repeatable process. Thus, I start each week with a review of the state of the big-picture environment. I then look at the current trend and the degree of momentum behind the move. Next, I explore the potential for a countertrend move to develop via our Early Warning Indicator Board, which is designed to indicate when "the table might be set" for the trend to "go the other way" for a while.
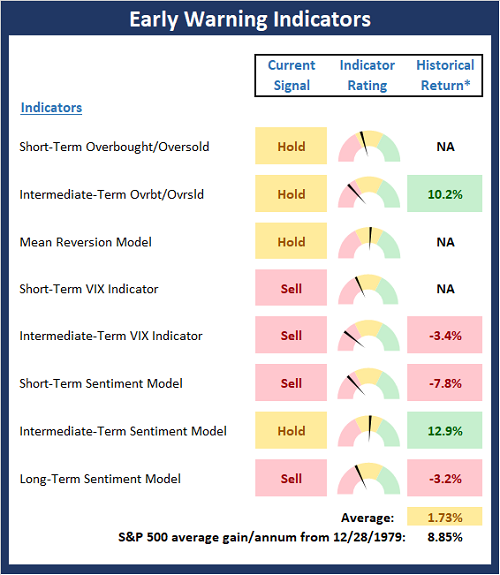
The State of the "Early Warning" Indicators
There is one change to the Early Warning board this week as the Long-Term Sentiment Model flipped from buy to sell and is now negative. This causes the average hypothetical annualized return of the S&P 500 based on the current model readings to fall from last week's +6.6% to +1.7% this week. The takeaway here is that although the trend of the market is up, (1) the historical return given the current state of the Early Warning Indicators has not been robust and (2) the "table" is clearly set for some countertrend action - or at the very least, a period of consolidation.
View Early Warning Indicator Board Online
* Source: Ned Davis Research (NDR) as of the date of publication. Historical returns are hypothetical average annual performances calculated by NDR. Past performances do not guarantee future results or profitability - NOT INDIVIDUAL INVESTMENT ADVICE.
View Early Warning Indicator Board Online
Stochastic Review
I have found that reviewing the basic stochastics is a solid way to determine when an index or security may be ripe to "go the other way" for a while. I like to keep it simple here by using a 14 day %K (with 1-day smoothing) and a 3 day %D. It's not fancy, but it tends to be an effective tool for an oftentimes complex subject.
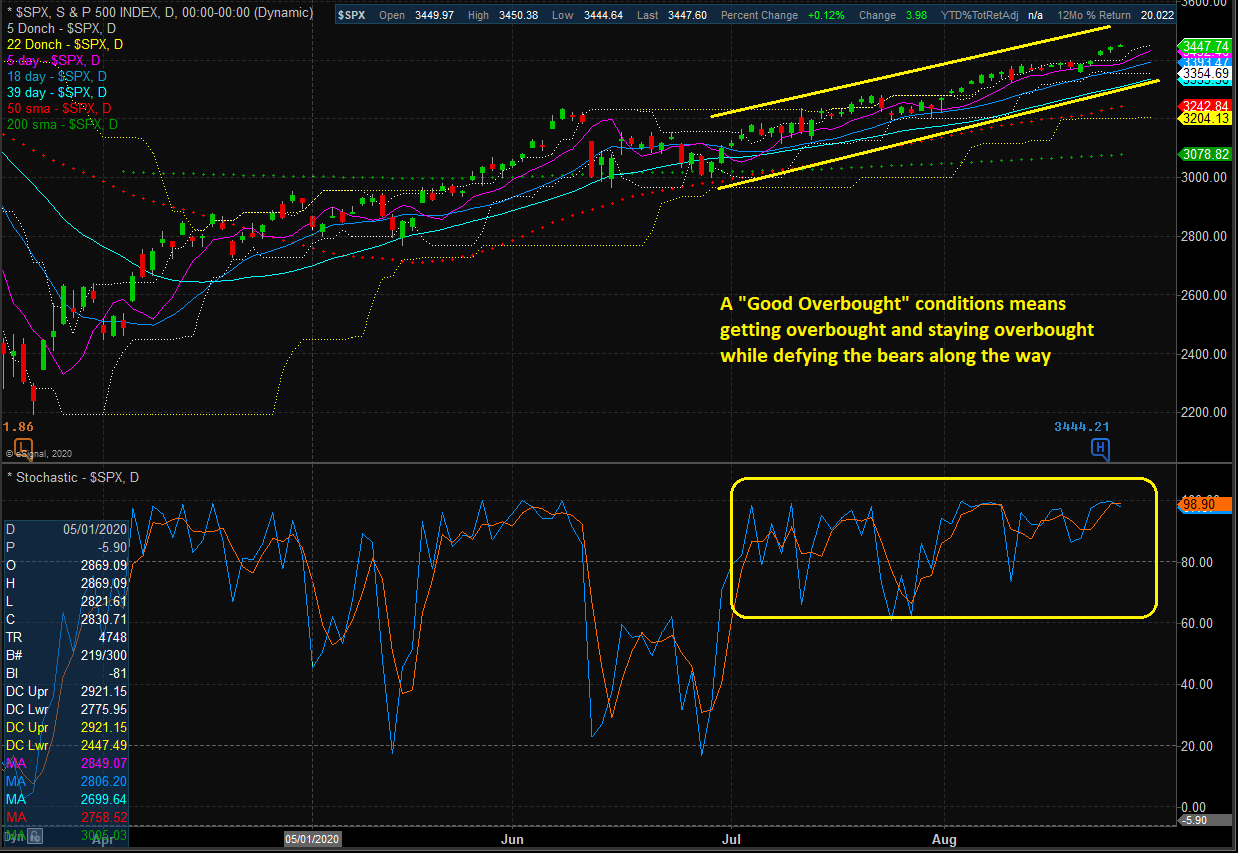
S&P 500 - Daily
View Large Chart Online
With the market seemingly inching higher on a daily basis with little downside action since the end of June, my take has been that we've got a "good overbought" condition on our hands - where stocks get overbought and stay overbought for an extended period of time.
What usually happens next is something comes along to give the bears a raison d'etre, which produces a violent decline in response. Typically, the dance to the downside that follows an overbought condition that is accompanied by extremely positive sentiment (check) is a move that tends to wipe out a healthy portion of the rally in a very short period of time.
In my experience, this is when it is best to put additional funds to work. However, the wait for such a pullback can be painful for those with cash on the sidelines!
Publishing Note: I have an early commitment tomorrow morning (yes, again) and will not publish a report.
Thought For The Day:
We make a living by what we get, we make a life by what we give. -Winston Churchill
Wishing you green screens and all the best for a great day,

David D. Moenning
Founder, Chief Investment Officer
Heritage Capital Research

Disclosures
At the time of publication, Mr. Moenning held long positions in the following securities mentioned: None - Note that positions may change at any time.
Early Warning Models Explained
Short-Term Overbought/sold Indicator: This indicator is the current reading of the 14,1,3 stochastic oscillator. When the oscillator is above 80 and the %K is above the %D, the indicator gives an overbought reading. Conversely, when the oscillator is below 20 and %K is below its %D, the indicator is oversold.
Intermediate-Term Overbought/sold Indicator: This indicator is a 40-day RSI reading. When above 57.5, the indicator is considered overbought and wnen below 45 it is oversold.
Mean Reversion Model: This is a diffusion model consisting of five indicators that can produce buy and sell signals based on overbought/sold conditions.
VIX Indicator: This indicators looks at the current reading of the VIX relative to a series of Donchian Channel bands. When the indicator reaches an extreme reading in either direction, it is an indication that a market trend could reverse in the near-term.
Short-Term Sentiment Indicator: This is a model-of-models composed of 18 independent sentiment indicators designed to indicate when market sentiment has reached an extreme from a short-term perspective. Historical analysis indicates that the stock market's best gains come after an environment has become extremely negative from a sentiment standpoint. Conversely, when sentiment becomes extremely positive, market returns have been subpar.
Intermediate-Term Sentiment Indicator: This is a model-of-models composed of 7 independent sentiment indicators designed to indicate when market sentiment has reached an extreme from a intermediate-term perspective. Historical analysis indicates that the stock market's best gains come after an environment has become extremely negative from a sentiment standpoint. Conversely, when sentiment becomes extremely positive, market returns have been subpar.
Long-Term Sentiment Indicator: This is a model-of-models composed of 6 independent sentiment indicators designed to indicate when market sentiment has reached an extreme from a long-term perspective. Historical analysis indicates that the stock market's best gains come after an environment has become extremely negative from a sentiment standpoint. Conversely, when sentiment becomes extremely positive, market returns have been subpar.
NOT INVESTMENT ADVICE. The opinions and forecasts expressed herein are those of Mr. David Moenning and Heritage Capital Research and may not actually come to pass. The opinions and viewpoints regarding the future of the markets should not be construed as recommendations. The analysis and information in this report is for informational purposes only. No part of the material presented in this report is intended as an investment recommendation or investment advice. Neither the information nor any opinion expressed constitutes a solicitation to purchase or sell securities or any investment program.
Any investment decisions must in all cases be made by the reader or by his or her investment adviser. Do NOT ever purchase any security without doing sufficient research. There is no guarantee that the investment objectives outlined will actually come to pass. All opinions expressed herein are subject to change without notice. Neither the editor, employees, nor any of their affiliates shall have any liability for any loss sustained by anyone who has relied on the information provided.
Mr. Moenning of Heritage Capital Research is an investment adviser representative of Eastsound Capital Advisors, LLC, a registered investment advisor. The adviser may not transact business in states where it is not appropriately registered, excluded or exempted from registration. Individualized responses to persons that involve either the effecting of transaction in securities, or the rendering of personalized investment advice for compensation, will not be made without registration or exemption.
Mr. Moenning and Heritage Capital Research may at times have positions in the securities referred to and may make purchases or sales of these securities while publications are in circulation. Positions may change at any time.
The analysis provided is based on both technical and fundamental research and is provided "as is" without warranty of any kind, either expressed or implied. Although the information contained is derived from sources which are believed to be reliable, they cannot be guaranteed.
The author neither endorses nor warrants the content of this site, any embedded advertisement, or any linked resource. The author or his managed funds may hold either long or short positions in the referenced securities. Republication rights must be expressly granted by author in writing.
Investments in equities carry an inherent element of risk including the potential for significant loss of principal. Past performance is not an indication of future results.