The Base Level Assumption Should Now Be...
Good morning and welcome back to the game. Since it's Monday, let's start the week with a review of the state of the market and our major market indicators/models.
As usual, the first stop is a review of the price/trend of the market. Here's my current take on the state of the technical picture...
- The most bullish thing a market can do is make new highs. Check.
- The rally stalled a bit last week
- However, the bears have not found a reason to test the breakout area yet
- The S&P 500 has now been above my modified 5-day moving average for 17 days
- The trend is clearly up
- The bulls have earned a rest
- We should expect a retest of the breakout area in near-term. But so far so good.
S&P 500 - Daily 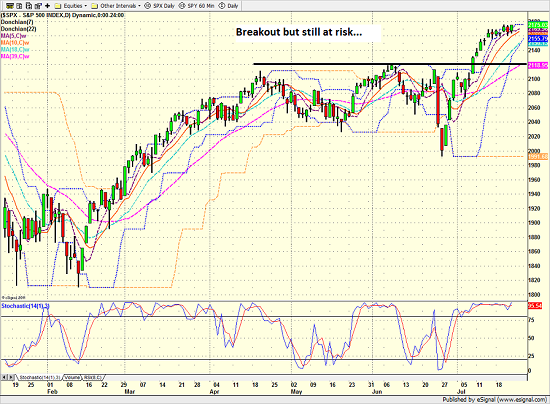
View Larger Image
From a longer-term perspective (e.g. looking at a weekly chart of the S&P 500)...
- One of my concerns last week was the fact that long-term, important breakouts should be "confirmed" by moving at least 2% above the breakout area.
- The breakout was confirmed on Friday
- Charts suggest that a new upleg has begun
- We will want to see confirmation of the new upleg from the momentum indicators
- Ned Davis Research announced that stocks officially entered a new bull market last week.
- NDR tells us that this type of bull market (a cyclical bull within the context of a secular bull) produces a median gain of 77.2% (the mean is 106%) over 2.1 years.
- The S&P 500 is up 18.9% from the 2/11 low - thus it would appear that there is a lot of upside available over the next couple years.
S&P 500 - Weekly 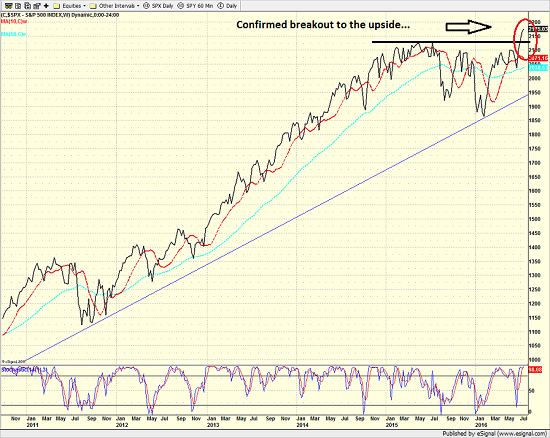
View Larger Image
Here's the view of the "state of the trend" from our indicator panel.
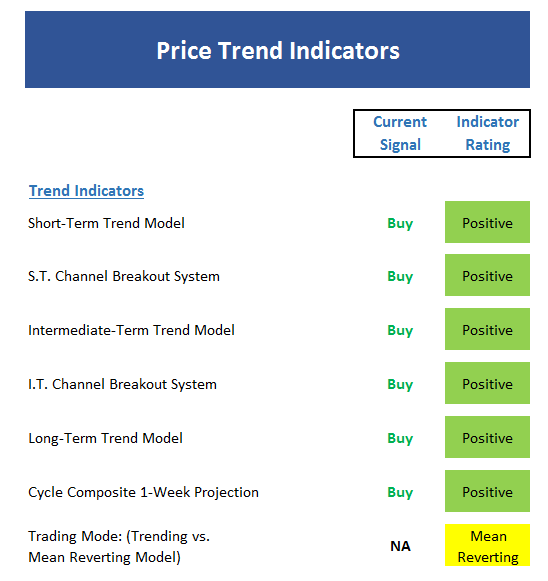
- The message from this board is clear - that's a lot of green
- The only fly in the ointment are our "trading mode" indicators, which still unanimously contend stocks are in a mean-reverting mode
- However, these models tend to be lagging indicators. As such, I would expect to seem them confirm the uptrend and move to a trending mode in the near future.
- The cycle composite is now positive
- The cycle composite projects an uptrend into the middle of August.
Next up is the momentum indicator board...
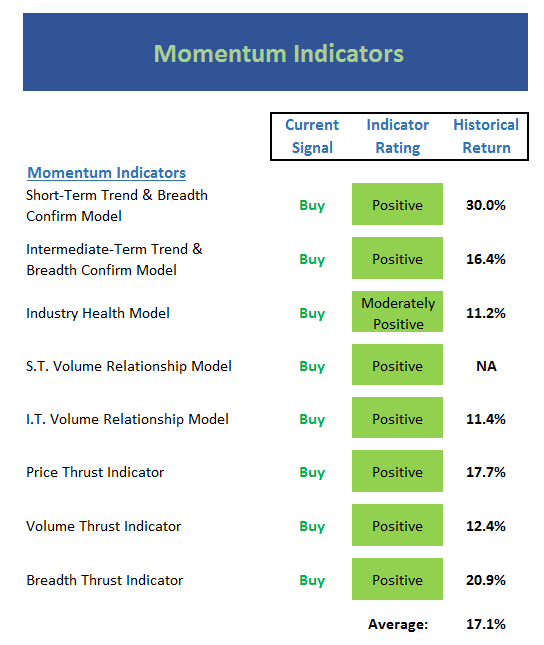
- Speaking of green...
- One of the most encouraging aspects of this move has been the momentum behind the move. Historically, this has been indicative of an important, sustainable move.
- Both volume relationship models are in great shape
- The volume thrust indicator hit its highest reading since the secular bull market began in March 2009.
- As I have mentioned, the breadth thrust indicator hit its highest reading since January 1987.
- While there is no indicator for this on the board, it is important to note that the momentum thrust is also global in nature.
- My only complaint here is that our Industry Health model has not moved up into the purely bullish zone yet. I would expect to see this occur in the near future.
- However, note that the historical return on this board is now nearly double the S&P's average.
Next up is the "early warning" board, which is designed to indicate when traders may start to "go the other way" for a trade.
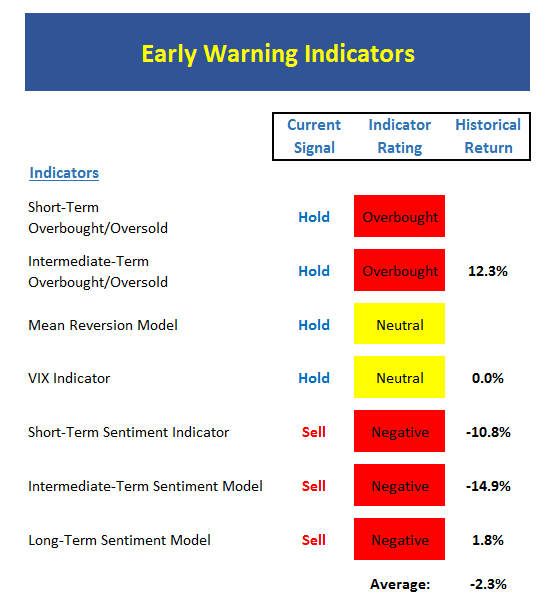
- As expected, the Early Warning board is now like a 3rd grader who knows the answer to the teacher's question and desperately wants to be noticed.
- Stocks remain overbought from both a short- and intermediate-term perspective.
- At this point, we view the condition as a "good overbought" situation.
- As such, we continue to rate the overbought models as "hold"
- Our Mean Reversion model remains neutral
- The VIX model did flash a sell signal. However, the VIX has continued to fall and thus, the signal has "worn off." Thus, we are waiting for another sell to be issued from this model.
- The key here is to remember that during meaningful moves, stocks get overbought and stay overbought
Now let's move on to the market's "external factors" - the indicators designed to tell us the state of the big-picture market drivers including monetary conditions, the economy, inflation, and valuations.
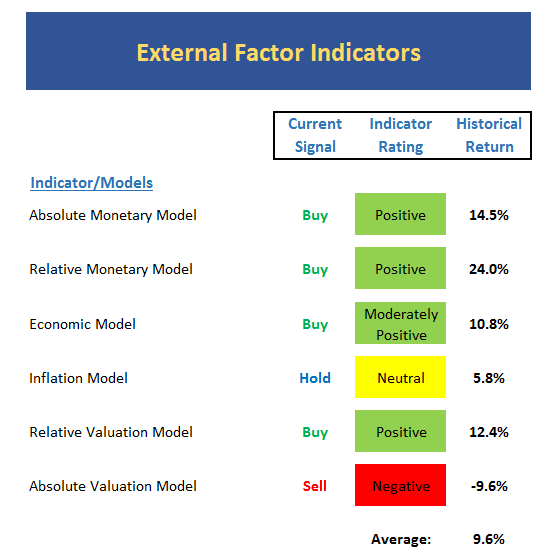
- There is a change to be noted on the board this week.
- Our Relative Monetary Model has moved back into the positive mode and stocks have historically done very well when this model is positive.
- There has also been some movement in the economic model. While the model technically moved down to neutral, the market tends to be strong in this mode so we continue to rate the model as moderately positive.
- While the signal is not new, I think it is important to note that the inflation model is neutral
- All in, the average return reading suggests that stocks should produce returns in line with the historical mean.
Finally, let's turn to our favorite big-picture market models, which are designed to tell us which team is in control of the prevailing major trend.
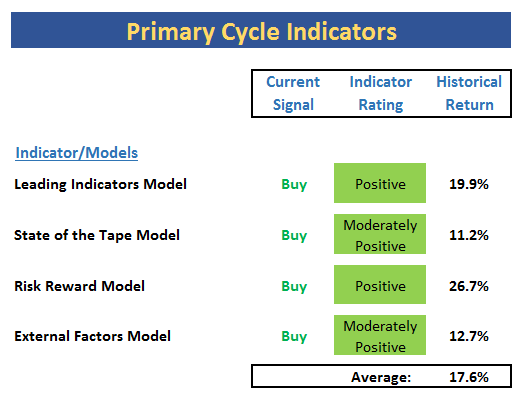
- While the external factors board suggests stocks will perform in line with long-term averages, our favorite models suggest that stocks will do much better - almost double the historical average.
- The big change this week is the fact that the Risk/Reward Model finally moved up into the positive zone. I view this as another confirmation of the uptrend.
- With all 4 models sporting green boxes, it is hard to be overly negative here.
The Takeaway...
To be sure, stocks are overbought and due for a pause. However, before you get excited about shorting the market here, it is important to remember that during strong, meaningful moves in the market, stocks get overbought and stay overbought. As such, waiting for the "no brainer" pullback that the fast-money types yammer on about daily could be a painful experience here. Obviously stocks won't go straight up from here. However, if a new cyclical bull market has indeed begun, the trading range strategy that has been so popular since late 2014 is likely to struggle going forward.
And to be clear, I too expect to see the market pull back and retest the 2120 area at some point - perhaps soon. And if the "retest" is successful (meaning the bulls hold the line during the retest) this would be yet another sign that a new bull phase has begun. However, since the breakout has been so long in coming, it is natural to be skeptical. Yet my final note this week is that the message from our indicators is very clear at this time - it's a new bull market and it's time to play the game accordingly.
Current Market Drivers
We strive to identify the driving forces behind the market action on a daily basis. The thinking is that if we can both identify and understand why stocks are doing what they are doing on a short-term basis; we are not likely to be surprised/blind-sided by a big move. Listed below are what we believe to be the driving forces of the current market (Listed in order of importance).
1. The State of Global Central Bank Policies
2. The State of Global Economic Growth
3. The Impact of the "BREXIT"
4. The State of the Stock Market Valuations
Thought For The Day:
Unless you change direction, you are likely to arrive at where you are headed. --Chinese Proverb
Here's wishing you green screens and all the best for a great day,

David D. Moenning
Founder: Heritage Capital Research
Chief Investment Officer: Sowell Management Services
Looking for More on the State of the Markets?
Disclosures
The opinions and forecasts expressed herein are those of Mr. David Moenning and may not actually come to pass. Mr. Moenning's opinions and viewpoints regarding the future of the markets should not be construed as recommendations. The analysis and information in this report is for informational purposes only. No part of the material presented in this report is intended as an investment recommendation or investment advice. Neither the information nor any opinion expressed constitutes a solicitation to purchase or sell securities or any investment program.
Any investment decisions must in all cases be made by the reader or by his or her investment adviser. Do NOT ever purchase any security without doing sufficient research. There is no guarantee that the investment objectives outlined will actually come to pass. All opinions expressed herein are subject to change without notice. Neither the editor, employees, nor any of their affiliates shall have any liability for any loss sustained by anyone who has relied on the information provided.
The analysis provided is based on both technical and fundamental research and is provided "as is" without warranty of any kind, either expressed or implied. Although the information contained is derived from sources which are believed to be reliable, they cannot be guaranteed.
David D. Moenning is an investment adviser representative of Sowell Management Services, a registered investment advisor. For a complete description of investment risks, fees and services, review the firm brochure (ADV Part 2) which is available by contacting Sowell. Sowell is not registered as a broker-dealer.
Employees and affiliates of Sowell may at times have positions in the securities referred to and may make purchases or sales of these securities while publications are in circulation. Positions may change at any time.
Investments in equities carry an inherent element of risk including the potential for significant loss of principal. Past performance is not an indication of future results.
Advisory services are offered through Sowell Management Services.
