Buckle Up, This Will Be Interesting
Good Monday morning and welcome back to the land of blinking screens. I hope you are buckled in as we've got a big week for the markets coming. So, before we review the state of the market models, let's take a look at what might shape the markets this week.
The news flow actually started to flow before the week began here in the U.S. We started with the reaction to the G-7 meeting, where there was some drama over U.S. tariffs. Next, Italy's new Finance Minister, Giovanni Tira, said nice things about the euro and that his government would block any conditions that would "push toward an exit." This pushed Italian stocks up 2% and helped European equities perk up.
Next up is the historic summit between President Trump and North Korean leader Kim Jong Un. Both have arrived in Singapore and senior officials are busy trying to iron out differences before the actual summit takes place. At stake here is security environment in Asia but there continues to be concerns about what the term "denuclearization" means to both sides.
Then the fun with the Central Bankers begins. First up is the U.S. Federal Reserve. Jay Powell's gang begins its two-day meeting on Tuesday. Just about everyone on the planet expects a 0.25% rate hike on Wednesday and another at the September meeting. However, the real question is about what happens after September. As such, market players will be listening for clues about the possibility of a fourth rate increase in 2018 and what Powell & Co. have planned for next year.
On Thursday, it's Super Mario's turn in the spotlight. No one expects the ECB to make any changes to its monthly QE program, where the bank currently purchases 30 billion euros of bonds. However, analysts will be listening intently to any discussion relating to when/how Draghi plans for ending its QE campaign.
On Friday, the central bank parade comes to a close with the Bank of Japan's meeting. There are no changes expected from the BOJ's "QE Infinity" approach, so this will likely be the least interesting meeting.
In between all the central bank meetings, investors will also get data on retail sales, inflation, and industrial production in the U.S., as well as some important manufacturing numbers out of China.
Oh and lest we forget, the U.S. is also engaged in trade negotiations on different fronts. So, like I said at the outset, it is probably a good idea to have your seatbelt fastened this week as there are any number of items that could cause the ride to become a bit bumpy.
Now move on to the indicators...
The State of the Big-Picture Market Models
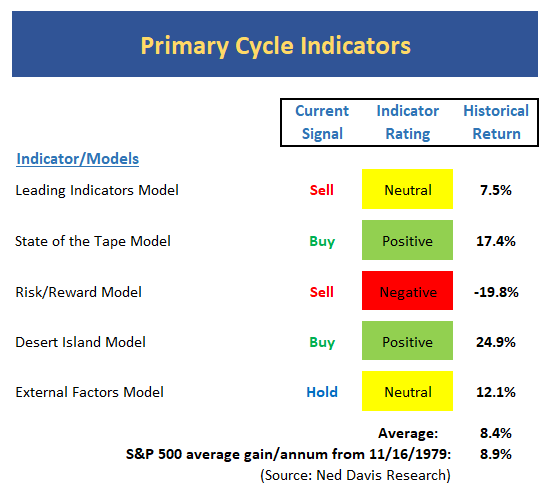
I like to start each week with a review of the state of my favorite big-picture market models, which are designed to help me determine which team is in control of the prevailing major trend.
View My Favorite Market Models Online
The Bottom Line:
- The average return of the Primary Cycle board's components appears to tell the whole story here. In short, while there are risk factors such as monetary conditions and valuation that are elevated, the trend and internal health of the market remains sound. As such, the bulls deserve the benefit of any doubt.
The State of the Trend
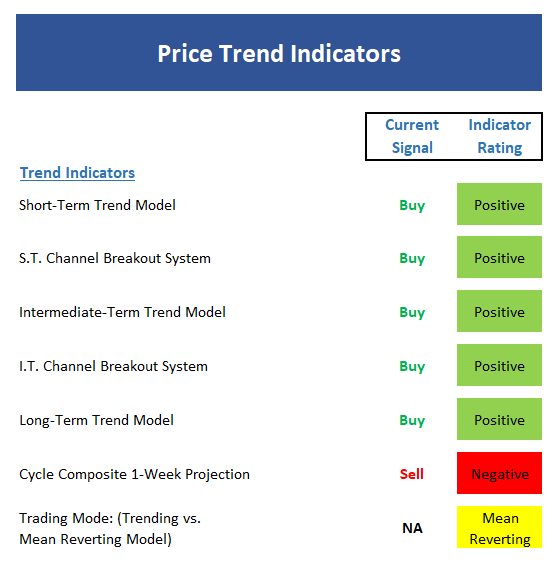
Once I've reviewed the big picture, I then turn to the "state of the trend." These indicators are designed to give us a feel for the overall health of the current short- and intermediate-term trend models.
View Trend Indicator Board Online
The Bottom Line:
- Last week, I opined that the trend of the S&P 500 was not actually as strong as the trend board might suggest. This week, I will retract that statement as the venerable index broke out of resistance and is in an uptrend. Advantage Bulls.
The State of Internal Momentum
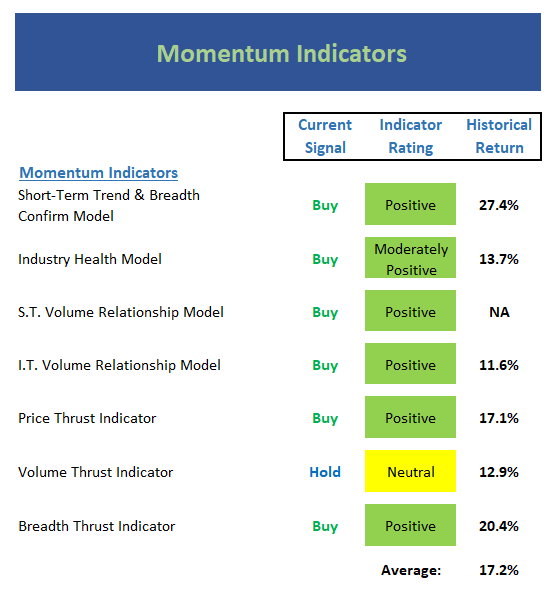
Next up are the momentum indicators, which are designed to tell us whether there is any "oomph" behind the current trend.
View Momentum Indicator Board Online
The Bottom Line:
- The market's internal momentum remains in good shape. 'Nuff said. Advantage Bulls.
The State of the "Trade"
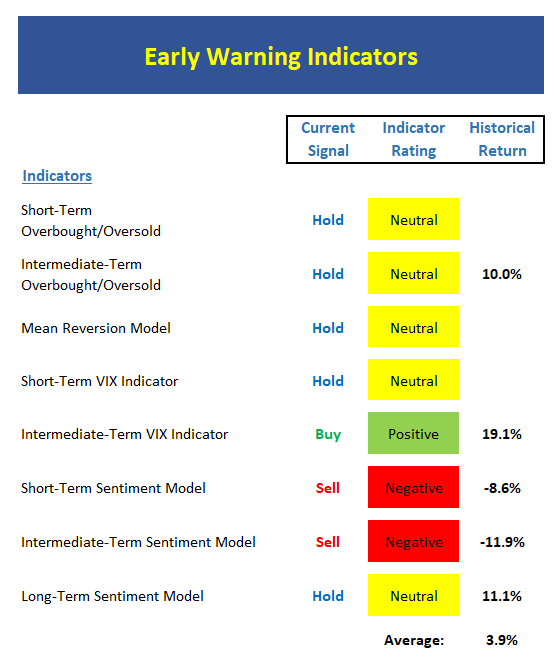
We also focus each week on the "early warning" board, which is designed to indicate when traders might start to "go the other way" -- for a trade.
View Early Warning Indicator Board Online
The Bottom Line:
- This week's "Early Warning" board doesn't clearly favor the bears yet (from a short-term perspective), but it does appear to be moving in that direction. Thus, we will give the bears a slight near-term advantage.
The State of the Macro Picture
Now let's move on to the market's "external factors" - the indicators designed to tell us the state of the big-picture market drivers including monetary conditions, the economy, inflation, and valuations.
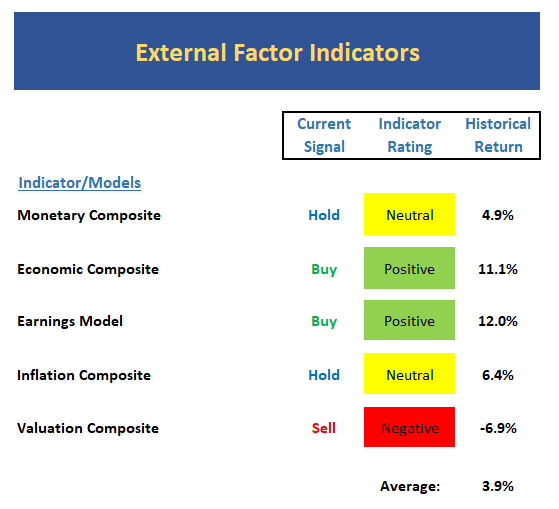
View External Factors Indicator Board Online
The Bottom Line:
- We have made some additional changes to the External Factors board. First, we have added an earnings component. Next, we have consolidated the Monetary and Valuation models into a composite. We believe the changes makes the board more useful and the addition of an earnings components helps partially offset the monetary and valuation conditions and brings the overall board more toward neutral.
Dynamic Asset Allocation Model
Below is an EXAMPLE of how one might utilize the indicator boards in a portfolio. The idea is to dynamically determine the appropriate equity allocation for a flexible, balanced asset allocation model with a base target of 60/40 stocks/bonds.
The overall intent of the model is to keep equity exposure in line with current conditions. Since the model is updated monthly, we take a longer-term approach and allocate 40% of the exposure to Environmental factors, 40% to Trend and Momentum factors, and 20% to Sentiment.
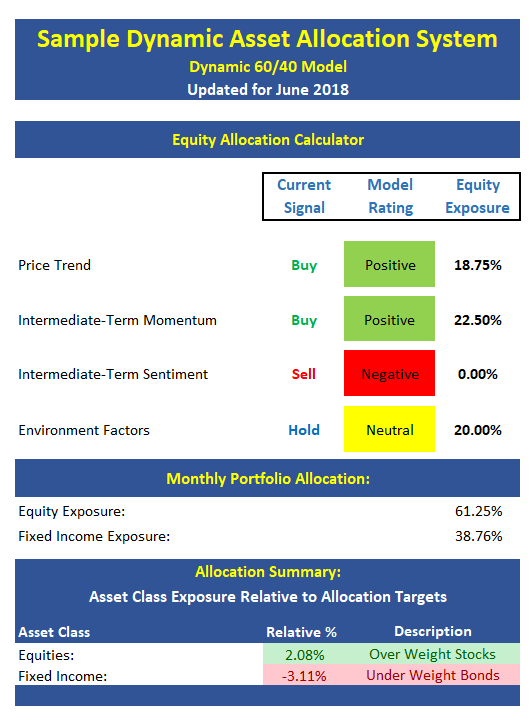
The model above is for illustrative and informational purposes only and does not in any way represent any investment recommendation. The model is merely a sample of how indicators can be grouped to create a guide to market exposure based on the inputs from multiple indicators/models.

ANNOUNCEMENT:
HCR Awarded Top Honors in 2018 NAAIM Shark Tank Portfolio Strategy Competition
Each year, NAAIM (National Association of Active Investment Managers) hosts a competition to identify the best actively managed investment strategies. In April, HCR's Dave Moenning took home first place for his flagship risk management strategy.
Want to Learn More? Contact Dave
A Word About Managing Risk in the Stock Market
Thought For The Day:
To understand one thing well is better than understanding many things by halves. — Johann Wolfgang Von Goethe
Wishing you green screens and all the best for a great day,

David D. Moenning
Founder, Chief Investment Officer
Heritage Capital Research
HCR Focuses on a Risk-Managed Approach to Investing
Must Read: What Risk Management Can and Cannot Do
HCR's Financial Advisor Services
HCR's Individual Investor Services
Questions, comments, or ideas? Contact Us
At the time of publication, Mr. Moenning held long positions in the following securities mentioned: None - Note that positions may change at any time.
Indicators Explained
Short-Term Trend-and-Breadth Signal Explained: History shows the most reliable market moves tend to occur when the breadth indices are in gear with the major market averages. When the breadth measures diverge, investors should take note that a trend reversal may be at hand. This indicator incorporates NDR's All-Cap Dollar Weighted Equity Series and A/D Line. From 1998, when the A/D line is above its 5-day smoothing and the All-Cap Equal Weighted Equity Series is above its 25-day smoothing, the equity index has gained at a rate of +32.5% per year. When one of the indicators is above its smoothing, the equity index has gained at a rate of +13.3% per year. And when both are below, the equity index has lost +23.6% per year.
Channel Breakout System Explained: The short-term and intermediate-term Channel Breakout Systems are modified versions of the Donchian Channel indicator. According to Wikipedia, "The Donchian channel is an indicator used in market trading developed by Richard Donchian. It is formed by taking the highest high and the lowest low of the last n periods. The area between the high and the low is the channel for the period chosen."
Intermediate-Term Trend-and-Breadth Signal Explained: This indicator incorporates NDR's All-Cap Dollar Weighted Equity Series and A/D Line. From 1998, when the A/D line is above its 45-day smoothing and the All-Cap Equal Weighted Equity Series is above its 45-day smoothing, the equity index has gained at a rate of +17.6% per year. When one of the indicators is above its smoothing, the equity index has gained at a rate of +6.5% per year. And when both are below, the equity index has lost -1.3% per year.
Industry Health Model Explained: Designed to provide a reading on the technical health of the overall market, Big Mo Tape takes the technical temperature of more than 100 industry sectors each week. Looking back to early 1980, when the model is rated as "positive," the S&P has averaged returns in excess of 23% per year. When the model carries a "neutral" reading, the S&P has returned over 11% per year. But when the model is rated "negative," stocks fall by more than -13% a year on average.
Cycle Composite Projections: The cycle composite combines the 1-year Seasonal, 4-year Presidential, and 10-year Decennial cycles. The indicator reading shown uses the cycle projection for the upcoming week.
Trading Mode Indicator: This indicator attempts to identify whether the current trading environment is "trending" or "mean reverting." The indicator takes the composite reading of the Efficiency Ratio, the Average Correlation Coefficient, and Trend Strength models.
Volume Relationship Models: These models review the relationship between "supply" and "demand" volume over the short- and intermediate-term time frames.
Price Thrust Model Explained: This indicator measures the 3-day rate of change of the Value Line Composite relative to the standard deviation of the 30-day average. When the Value Line's 3-day rate of change have moved above 0.5 standard deviation of the 30-day average ROC, a "thrust" occurs and since 2000, the Value Line Composite has gained ground at a rate of +20.6% per year. When the indicator is below 0.5 standard deviation of the 30-day, the Value Line has lost ground at a rate of -10.0% per year. And when neutral, the Value Line has gained at a rate of +5.9% per year.
Volume Thrust Model Explained: This indicator uses NASDAQ volume data to indicate bullish and bearish conditions for the NASDAQ Composite Index. The indicator plots the ratio of the 10-day total of NASDAQ daily advancing volume (i.e., the total volume traded in stocks which rose in price each day) to the 10-day total of daily declining volume (volume traded in stocks which fell each day). This ratio indicates when advancing stocks are attracting the majority of the volume (readings above 1.0) and when declining stocks are seeing the heaviest trading (readings below 1.0). This indicator thus supports the case that a rising market supported by heavier volume in the advancing issues tends to be the most bullish condition, while a declining market with downside volume dominating confirms bearish conditions. When in a positive mode, the NASDAQ Composite has gained at a rate of +38.3% per year, When neutral, the NASDAQ has gained at a rate of +13.3% per year. And when negative, the NASDAQ has lost at a rate of -8.5% per year.
Breadth Thrust Model Explained: This indicator uses the number of NASDAQ-listed stocks advancing and declining to indicate bullish or bearish breadth conditions for the NASDAQ Composite. The indicator plots the ratio of the 10-day total of the number of stocks rising on the NASDAQ each day to the 10-day total of the number of stocks declining each day. Using 10-day totals smooths the random daily fluctuations and gives indications on an intermediate-term basis. As expected, the NASDAQ Composite performs much better when the 10-day A/D ratio is high (strong breadth) and worse when the indicator is in its lower mode (weak breadth). The most bullish conditions for the NASDAQ when the 10-day A/D indicator is not only high, but has recently posted an extreme high reading and thus indicated a thrust of upside momentum. Bearish conditions are confirmed when the indicator is low and has recently signaled a downside breadth thrust. In positive mode, the NASDAQ has gained at a rate of +22.1% per year since 1981. In a neutral mode, the NASDAQ has gained at a rate of +14.5% per year. And when in a negative mode, the NASDAQ has lost at a rate of -6.4% per year.
Short-Term Overbought/sold Indicator: This indicator is the current reading of the 14,1,3 stochastic oscillator. When the oscillator is above 80 and the %K is above the %D, the indicator gives an overbought reading. Conversely, when the oscillator is below 20 and %K is below its %D, the indicator is oversold.
Intermediate-Term Overbought/sold Indicator: This indicator is a 40-day RSI reading. When above 57.5, the indicator is considered overbought and when below 45 it is oversold.
Mean Reversion Model: This is a diffusion model consisting of five indicators that can produce buy and sell signals based on overbought/sold conditions.
VIX Indicator: This indicator looks at the current reading of the VIX relative to standard deviation bands. When the indicator reaches an extreme reading in either direction, it is an indication that a market trend could reverse in the near-term.
Short-Term Sentiment Indicator: This is a model-of-models composed of 18 independent sentiment indicators designed to indicate when market sentiment has reached an extreme from a short-term perspective. Historical analysis indicates that the stock market's best gains come after an environment has become extremely negative from a sentiment standpoint. Conversely, when sentiment becomes extremely positive, market returns have been subpar.
Intermediate-Term Sentiment Indicator: This is a model-of-models composed of 7 independent sentiment indicators designed to indicate when market sentiment has reached an extreme from an intermediate-term perspective. Historical analysis indicates that the stock market's best gains come after an environment has become extremely negative from a sentiment standpoint. Conversely, when sentiment becomes extremely positive, market returns have been subpar.
Long-Term Sentiment Indicator: This is a model-of-models composed of 6 independent sentiment indicators designed to indicate when market sentiment has reached an extreme from a long-term perspective. Historical analysis indicates that the stock market's best gains come after an environment has become extremely negative from a sentiment standpoint. Conversely, when sentiment becomes extremely positive, market returns have been subpar.
Absolute Monetary Model Explained: The popular cliché, "Don't fight the Fed" is really a testament to the profound impact that interest rates and Fed policy have on the market. It is a proven fact that monetary conditions are one of the most powerful influences on the direction of stock prices. The Absolute Monetary Model looks at the current level of interest rates relative to historical levels and Fed policy.
Relative Monetary Model Explained: The "relative" monetary model looks at monetary indicators relative to recent levels as well as rates of change and Fed Policy.
Economic Model Explained: During the middle of bull and bear markets, understanding the overall health of the economy and how it impacts the stock market is one of the few truly logical aspects of the stock market. When our Economic model sports a "positive" reading, history (beginning in 1965) shows that stocks enjoy returns in excess of 21% per year. Yet, when the model's reading falls into the "negative" zone, the S&P has lost nearly -25% per year. However, it is vital to understand that there are times when good economic news is actually bad for stocks and vice versa. Thus, the Economic model can help investors stay in tune with where we are in the overall economic cycle.
Inflation Model Explained: They say that "the tape tells all." However, one of the best "big picture" indicators of what the market is expected to do next is inflation. Simply put, since 1962, when the model indicates that inflationary pressures are strong, stocks have lost ground. Yet, when inflationary pressures are low, the S&P 500 has gained ground at a rate in excess of 13%. The bottom line is inflation is one of the primary drivers of stock market returns.
Valuation Model Explained: If you want to get analysts really riled up, you need only to begin a discussion of market valuation. While the question of whether stocks are overvalued or undervalued appears to be a simple one, the subject is extremely complex. To simplify the subject dramatically, investors must first determine if they should focus on relative valuation (which include the current level of interest rates) or absolute valuation measures (the more traditional readings of Price/Earnings, Price/Dividend, and Price/Book Value). We believe that it is important to recognize that environments change. And as such, the market's focus and corresponding view of valuations are likely to change as well. Thus, we depend on our Valuation Models to help us keep our eye on the ball.
Disclosures
The opinions and forecasts expressed herein are those of Mr. David Moenning and may not actually come to pass. Mr. Moenning's opinions and viewpoints regarding the future of the markets should not be construed as recommendations. The analysis and information in this report is for informational purposes only. No part of the material presented in this report is intended as an investment recommendation or investment advice. Neither the information nor any opinion expressed constitutes a solicitation to purchase or sell securities or any investment program.
Any investment decisions must in all cases be made by the reader or by his or her investment adviser. Do NOT ever purchase any security without doing sufficient research. There is no guarantee that the investment objectives outlined will actually come to pass. All opinions expressed herein are subject to change without notice. Neither the editor, employees, nor any of their affiliates shall have any liability for any loss sustained by anyone who has relied on the information provided.
Mr. Moenning may at times have positions in the securities referred to and may make purchases or sales of these securities while publications are in circulation. Positions may change at any time.
The analysis provided is based on both technical and fundamental research and is provided "as is" without warranty of any kind, either expressed or implied. Although the information contained is derived from sources which are believed to be reliable, they cannot be guaranteed.
Investments in equities carry an inherent element of risk including the potential for significant loss of principal. Past performance is not an indication of future results.